
Calibration Project
Introduction
Together with your installation of the Pixotope Engine comes the Calibration Project. It can help you calibrate your tracking and it provides useful insights on how to setup your virtual production with Pixotope.
The Calibration Project is a good place to begin your journey with Pixotope. Here you can see how a basic VS and AR production is laid out. It also gives you a rundown of the ways you could integrate external data and controls with Pixotope Data Hub.
You can start by exploring the assets in the Content Browser.

Under Content/PixotopeCalibration/Maps you will find multiple different levels.
Let’s go through them one by one.
LVL_PixotopeVSSample
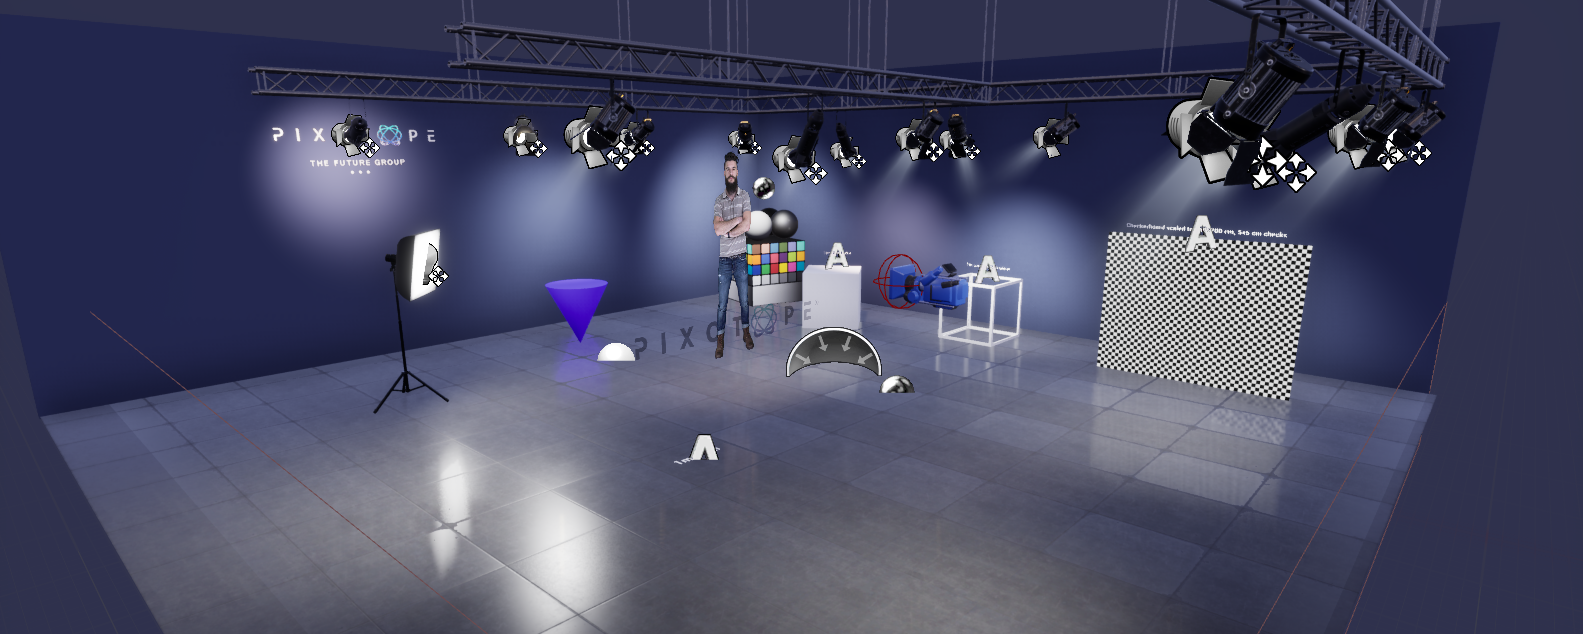
Pixotope VS Sample level, with Debug Video Input set to true, receiving tracking.
VS Sample level is a useful reference for calibrating your tracking and video inputs with Pixotope.
Here you’ll find meshes of strictly defined proportions which can be used as reference.
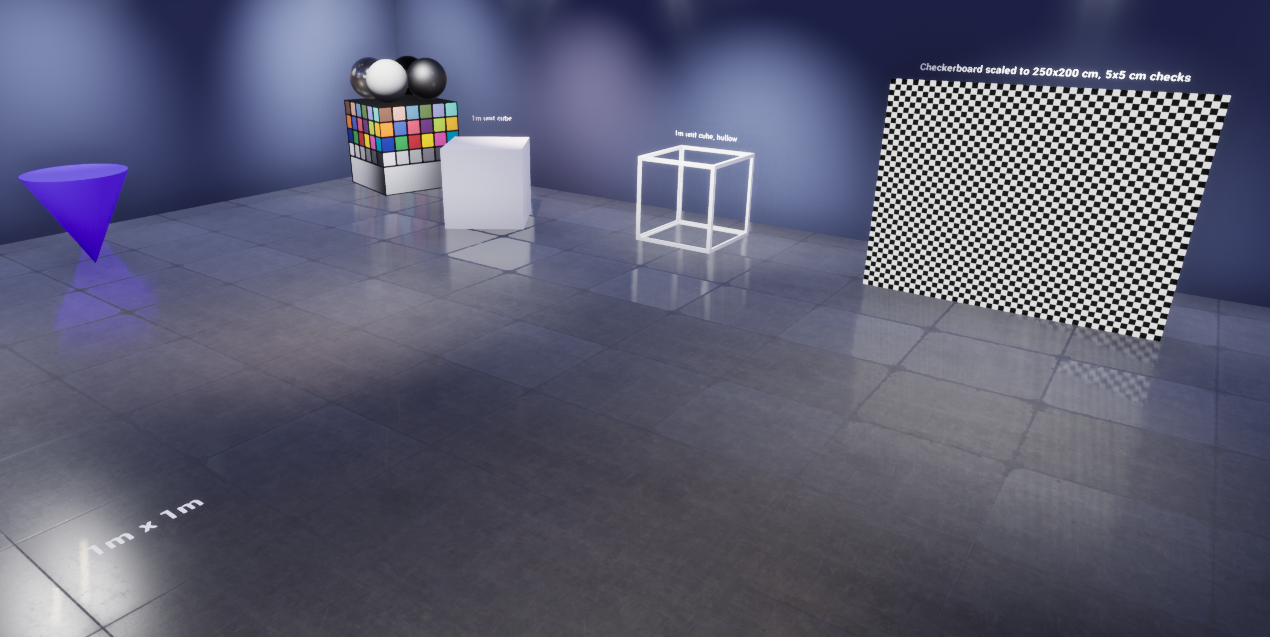
Calibration geometry.
Additionally, under Content/PixotopeCalibration/Sequences, there is an example level sequence showing off a virtual camera move.
It can be triggered with functions defined in the level blueprint, which could be called either with the Control Panel or custom API calls, or by pressing T when in Live or Live Preview mode.
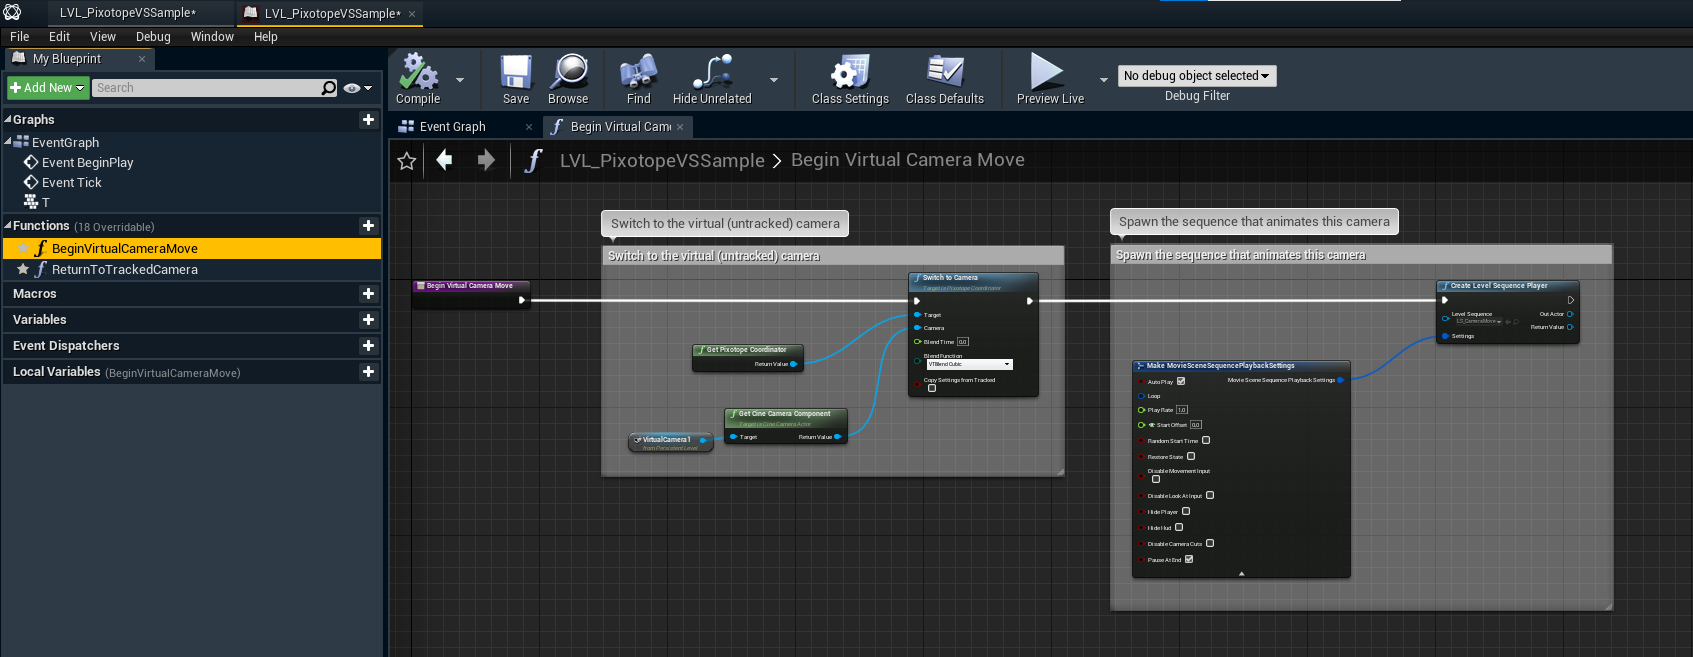
BeginVirtualCameraMove function in LVL_PixotopeVSSample level blueprint.
Remember to play around with the "Pixotope VS Compositing" settings in World Settings to better understand the possibilities you have with Pixotope.
LVL_PixotopeARSample
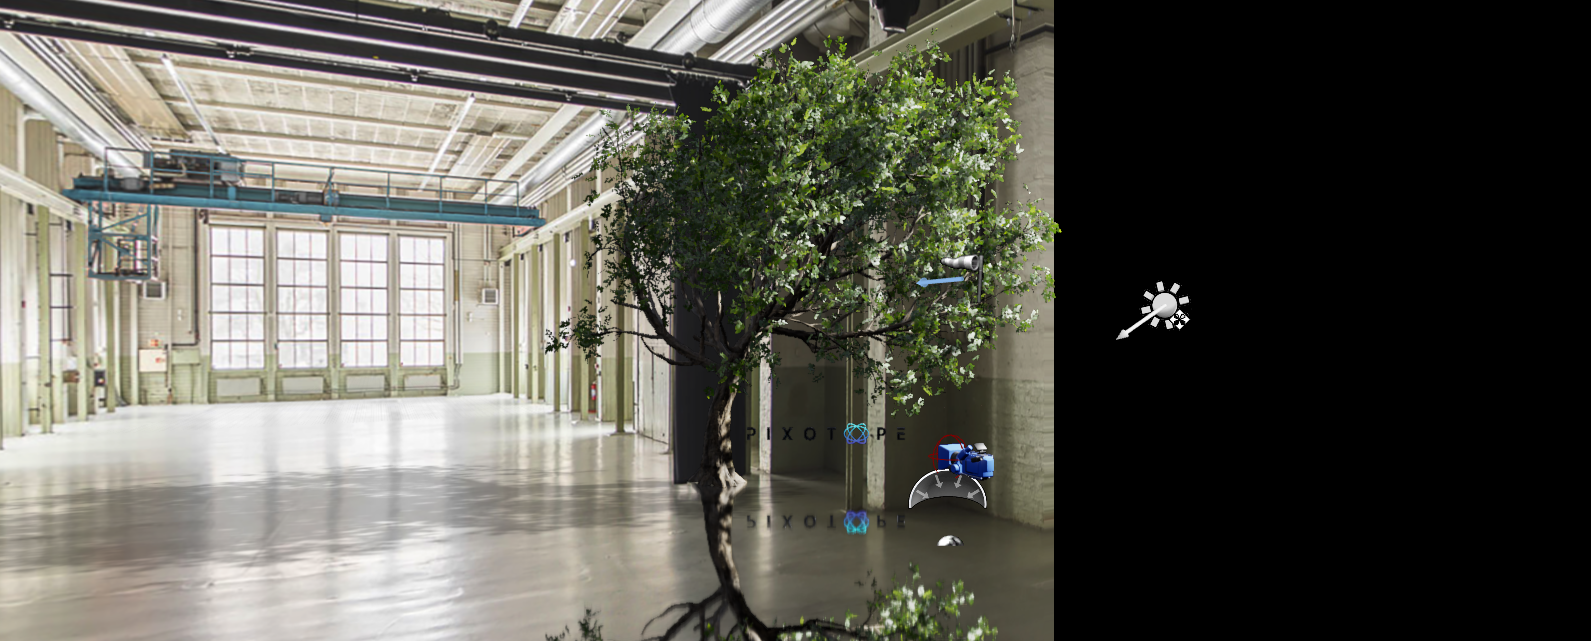
Pixotope AR Sample level, with Debug Video Input and AR WYSIWYG in Editor both set to true.
The AR Sample level, similarly to the VS Sample level, provides a reference for calibrating tracking and experimenting with settings.
Try different "Pixotope AR Compositing" settings in World Settings to understand it better.
LVL_PixotopeDataIntegration
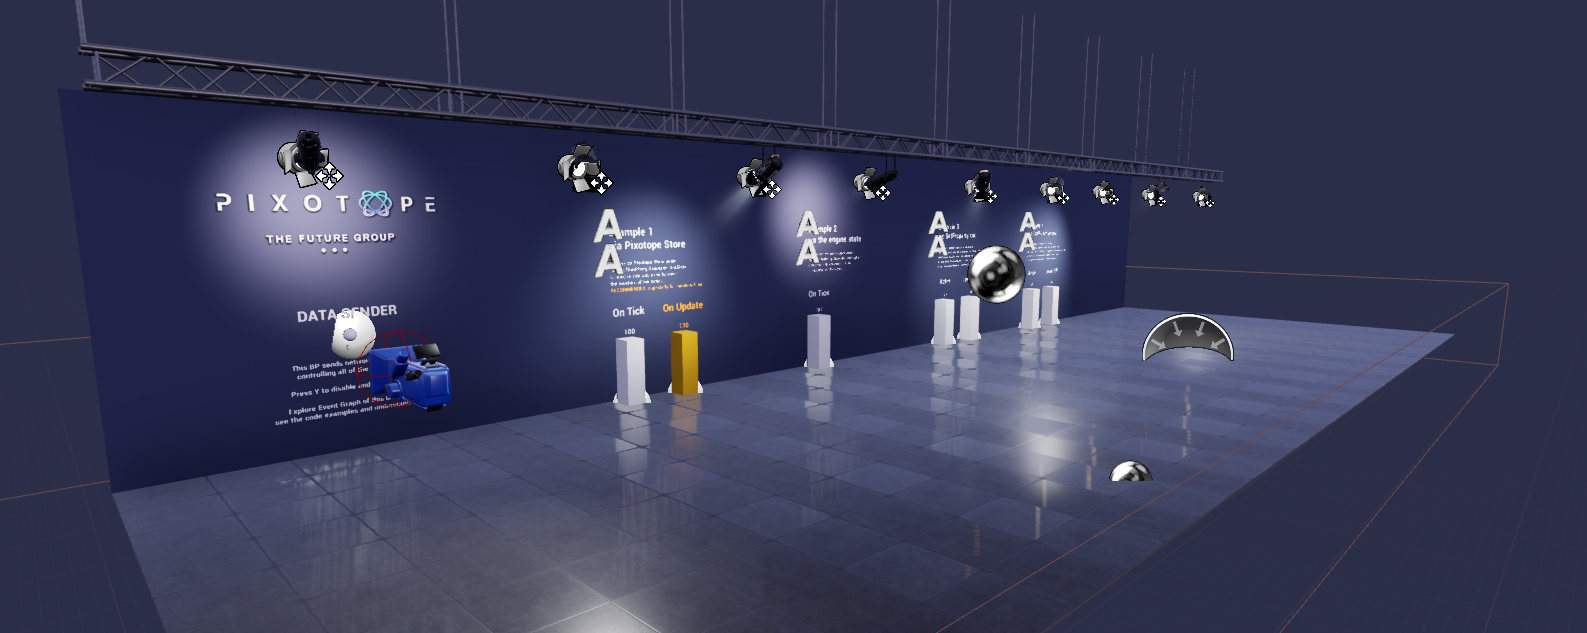
Pixotope Data Integration level, as it is.
The Data Integration level is your starting point when implementing your own control or data solutions with Pixotope. Here you have examples of all the major routes you can take when using Pixotope Data Hub.
This level is all about you trying to explore it, hack it, break it!
Under Content/PixotopeCalibration/Blueprints/DataIntegration there are all the blueprints used to set up these examples. Additionally there is some logic defined in the level blueprint.
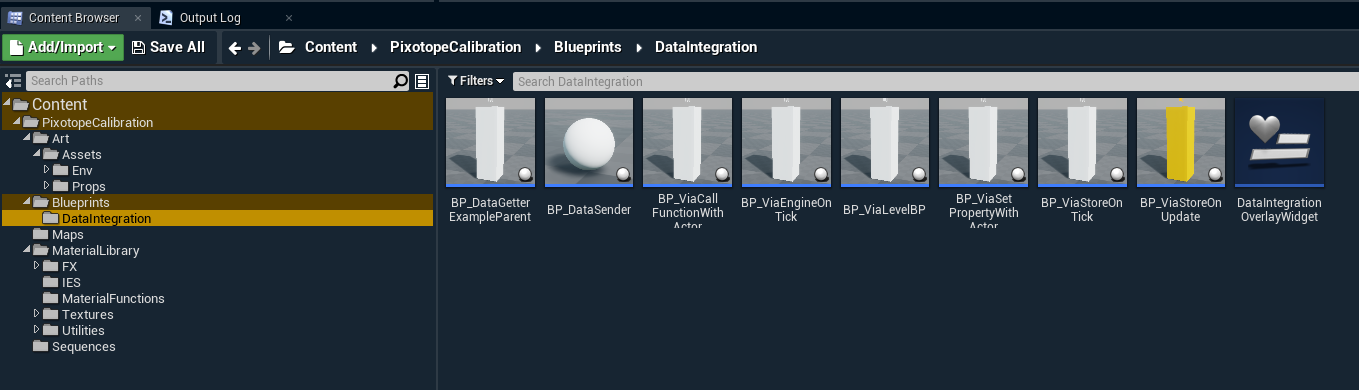
Open these blueprints! Try to understand how they work!
After pressing Preview Live you will find that this level has a couple of examples with bar-charts being fed remote values, and a Data Sender that emits these (it sends the values to Data Hub, and only then they reach the engine back, hence it could be anywhere, even on a different computer!)

Data Sender is where it all starts. If you press ‘Y' it’ll be disabled, and you can try to take control.
The best way to understand how to send control messages is to open BP_DataSender.
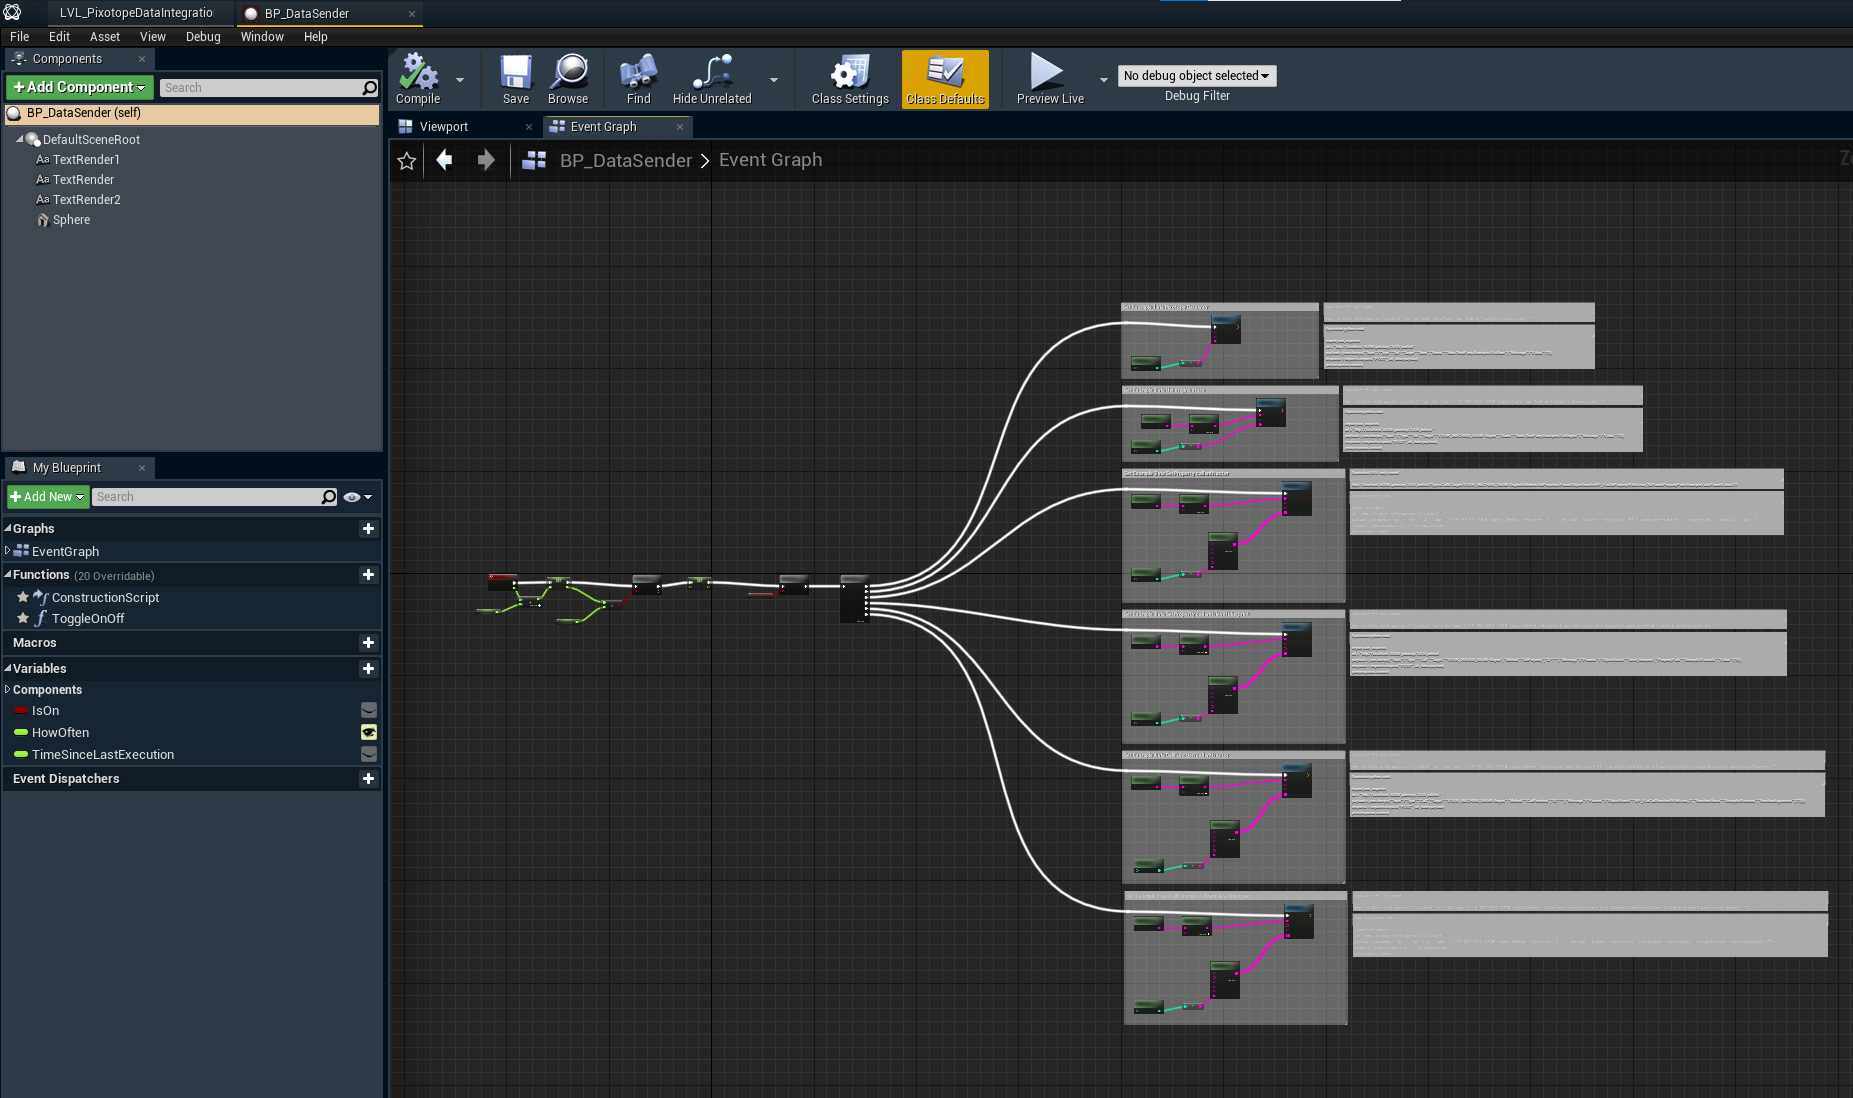
Here’s what you’ll find inside.
Each example has it’s blueprint implementation (just for show) as well as equivalent Python code and URL-only control snippets.
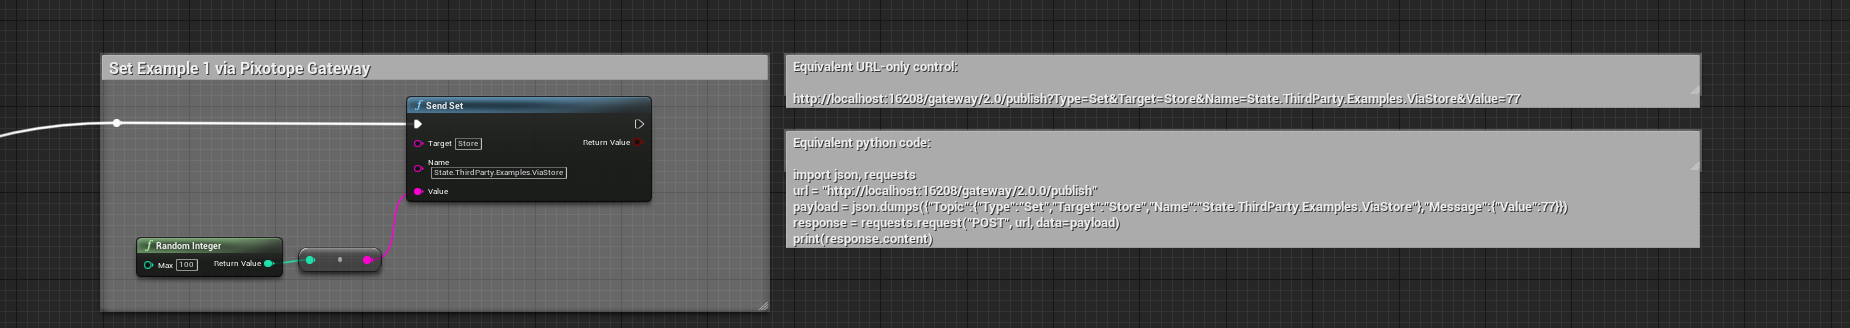
Any of these should just work. Although in some places you’ll need to replace YOUR_MACHINE_NAME with… your machine name.