
Tracking plotter - Experimental
This feature is experimental. We do not recommend using it in production.
See below: Known limitations and issues for this first version.
The Tracking plotter allows you to
inspect
export
incoming tracking data.
How to use the Tracking plotter
Preparations
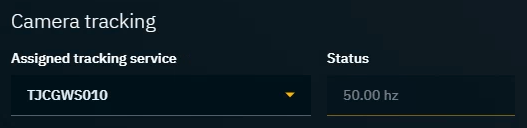
Make sure the camera system who’s tracking data you want to inspect has
the correct tracking protocol selected
and the Status field shows incoming data
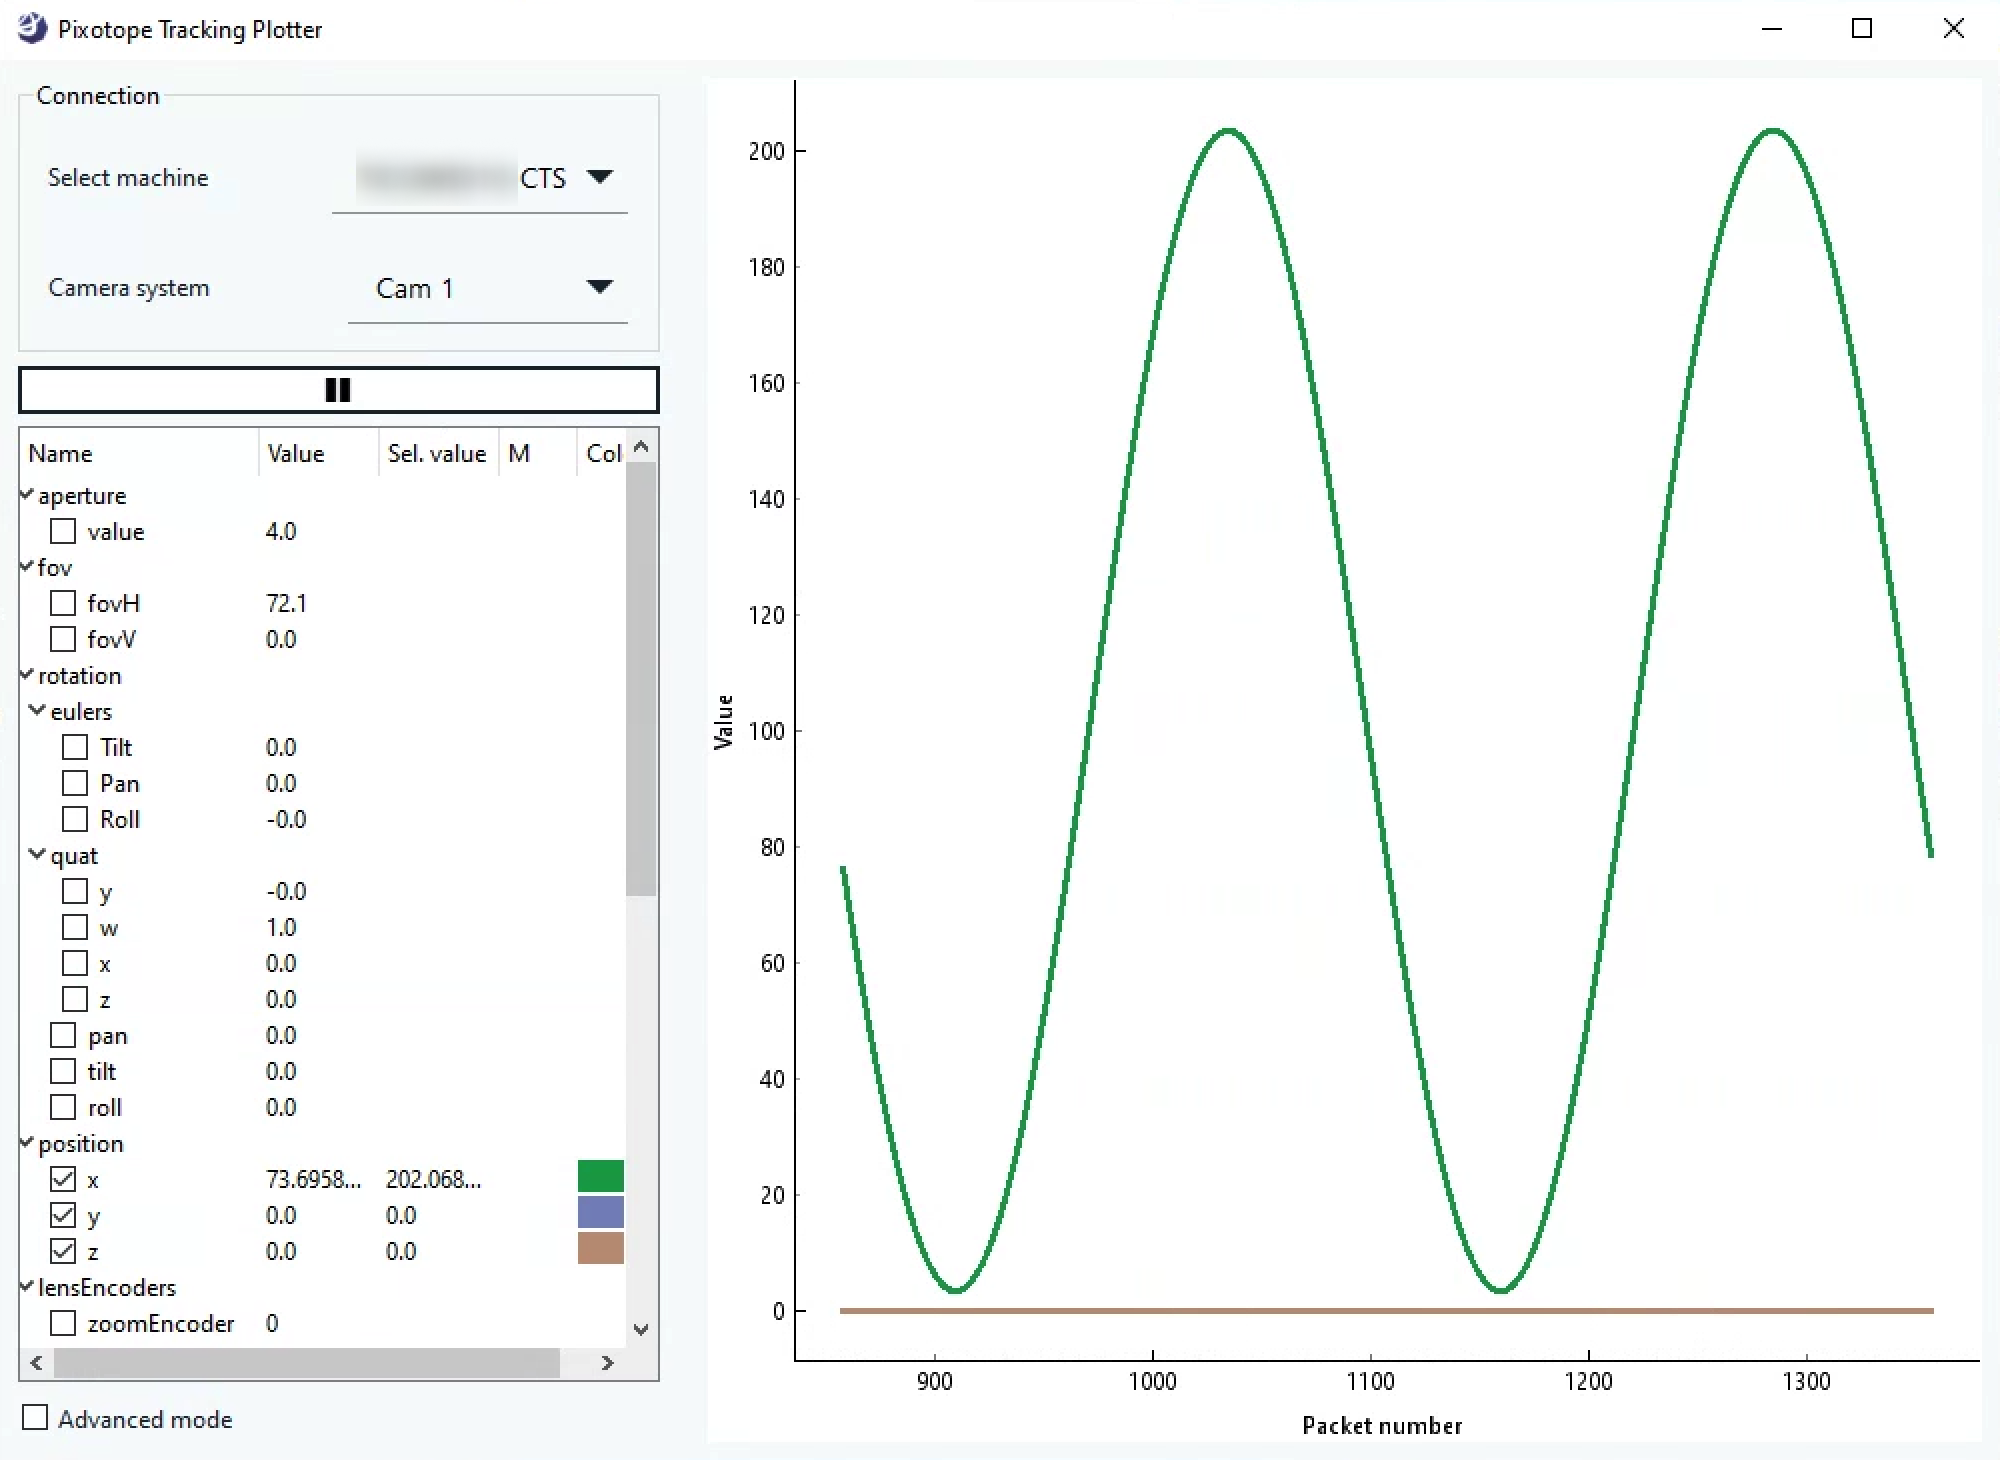
Open the Tracking plotter
Start the Tracking Plotter by double clicking
Run-LiveTrackingPlot.exein[Installation folder]\Services\TrackingSelect the machine and the camera system for which you want to inspect the tracking data
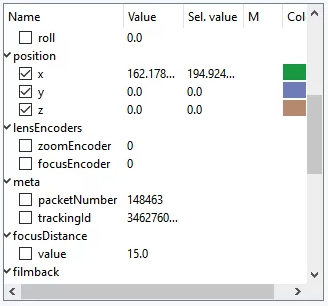
Select the properties you want to display
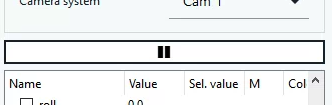
Use the Pause button to pause or restart updating the tracking data
Advanced mode
Shows all parameters, also the previously hidden ones
Allows for saving settings to be used on next startup
Allows for viewport manipulation
Allows for exporting data
Show difference data
Right click the parameter which you want to see its difference data of
Click “Setup filters”
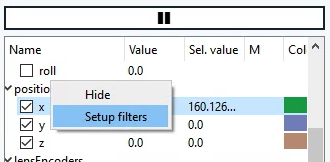
Select the Adjacent difference filter and click “Add filter”
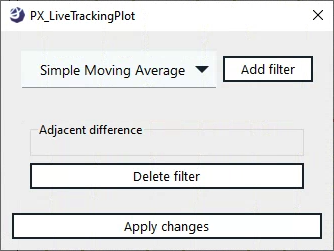
Click “Apply changes"
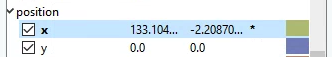
A parameter which has a filter applied is indicated by a small *
Filters can be combined. For example is the Adjacent difference filter sometimes combined with the Simple Moving Average filter.
Export tracking data for debugging
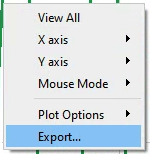
Enable Advanced mode
Right click in the viewport and click “Export…”
Choose the data and format you like and click “Export”
Known limitations and issues
Plotting tracking data with a frequency higher than 100Hz might cause incorrect curves