The panels in the diagnostics section allow you to
-
Monitor hardware data
-
Switch between main and backup machines using an external Videohub router
Want to check the network health? Learn more about how to test the network health
Monitor hardware data
Monitoring machine data in real time can be essential for identifying failing hardware.
Our health panel shows you the current state of relevant hardware data on all connected machines.
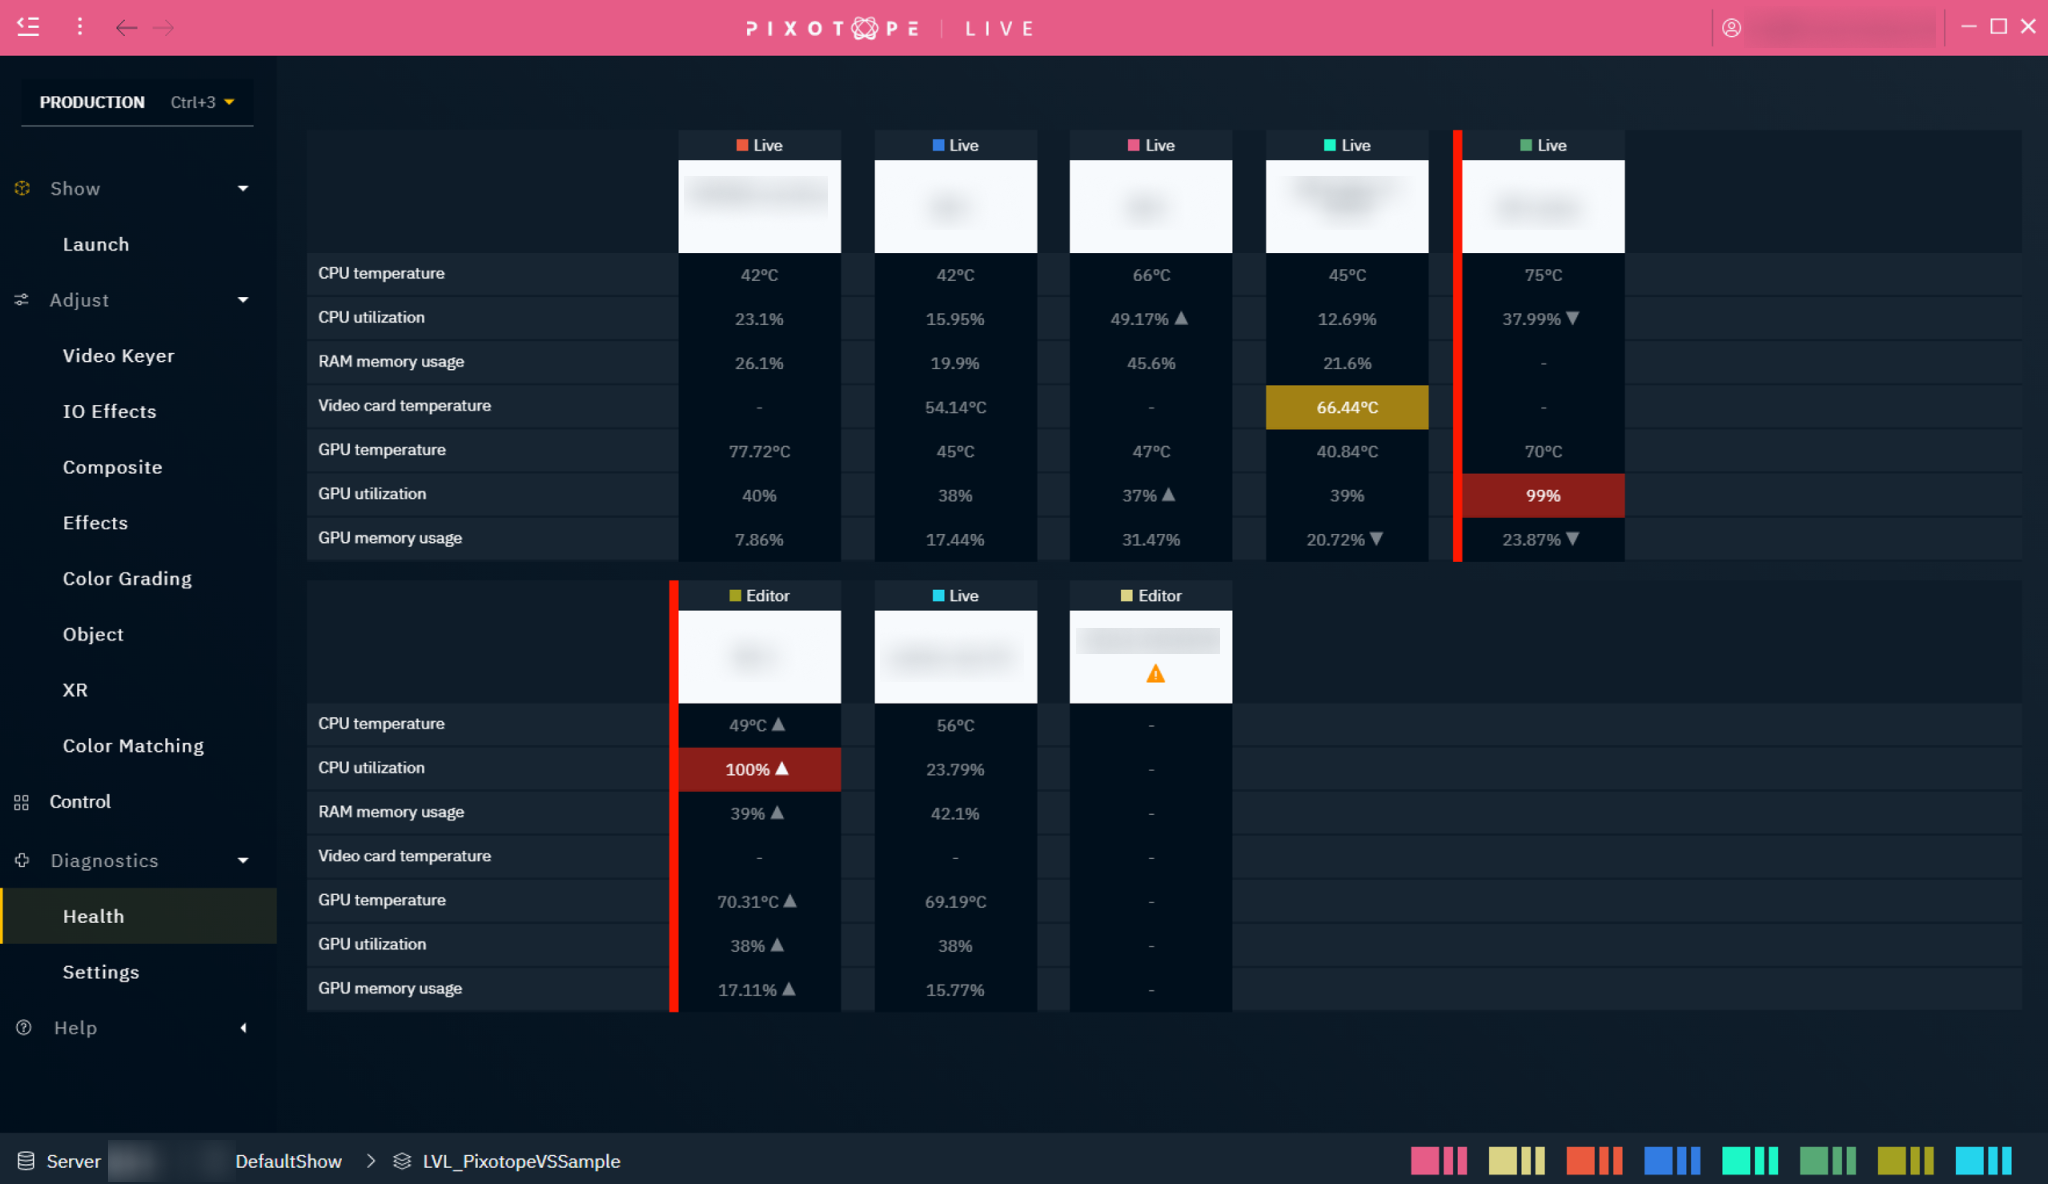
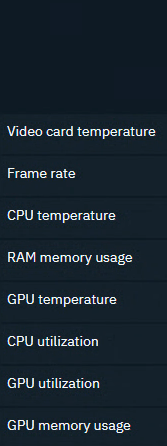
Hardware data
-
CPU core temperature
-
CPU core utilization
-
Video card temperature
-
RAM memory usage
-
GPU core temperature
-
GPU core utilization
-
GPU memory usage
States
|
|
Not running |
Normal |
Warning |
Critical |
|---|---|---|---|---|
|

|

|

|

|
To get this real time data from your hardware, our Pixotope diagnostics service needs elevated permissions. Windows' User Account Control needs to be confirmed
-
for every monitored machine
-
on every restart (unless User Account Control is deactivated)
Set up health monitoring
-
Go to PRODUCTION > Diagnostics > Health
-
Click "Start local diagnostics service" and confirm the User Account Control dialog
-
This starts the Pixotope diagnostics service
-
-
If visible machines are missing data
-
Access the Director on this machine
-
Go to PRODUCTION > Diagnostics > Settings
-
Click "Start local diagnostics service" and confirm the User Account Control dialog
-
Learn more about how to Start local diagnostics service on startup
Adjust the amount of machines displayed in a row
-
Go to PRODUCTION > Diagnostics > Settings
-
Change the number of machines displayed in a single row
Adjust thresholds
The default thresholds for when a Warning or a Critical state should be displayed might differ depending on your hardware or the levels you run. To adjust them
-
Go to PRODUCTION > Diagnostics > Settings
|
Parameter |
Default threshold
|
Default threshold
|
|---|---|---|
|
CPU core temperature |
75°C |
85°C |
|
CPU core utilization |
50% |
60% |
|
Video card temperature |
60°C |
75°C |
|
RAM memory usage |
50% |
70% |
|
GPU core temperature |
85°C |
95°C |
|
GPU core utilization |
75% |
95% |
|
GPU memory usage |
60% |
80% |
Switch between Main and Backup machines
Learn more about how to Set up render machine backups (failover)