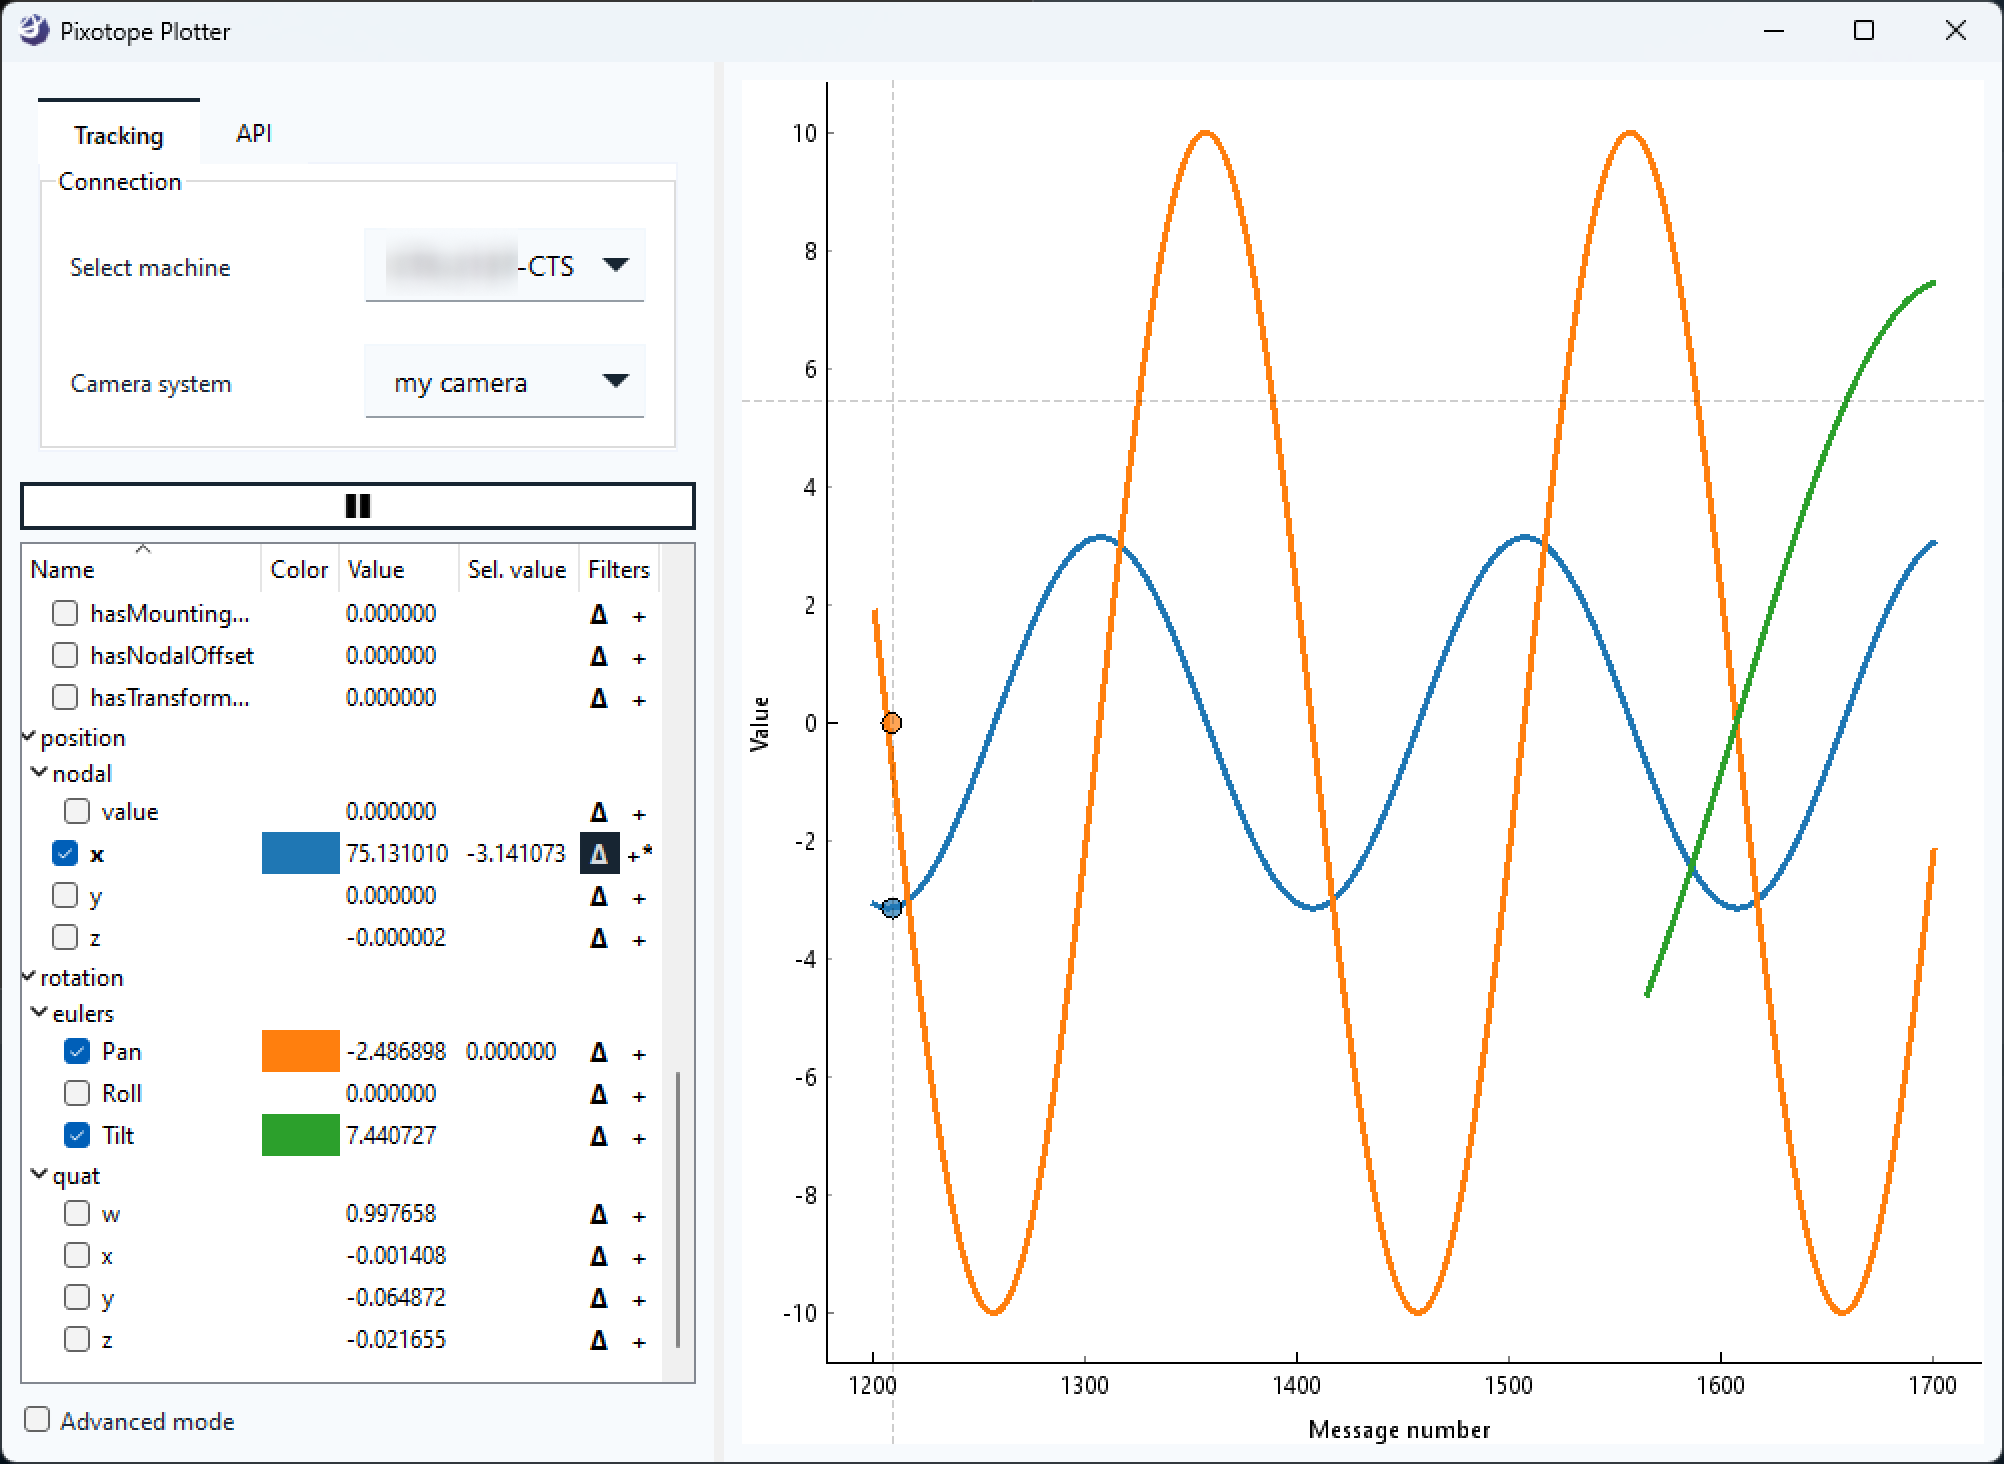
The Pixotope Plotter allows you to inspect and export
-
incoming tracking data
-
API values
Prepare
-
Make sure the camera system who’s tracking data you want to inspect has
-
the correct tracking protocol selected
-
and the Status field shows incoming data
-
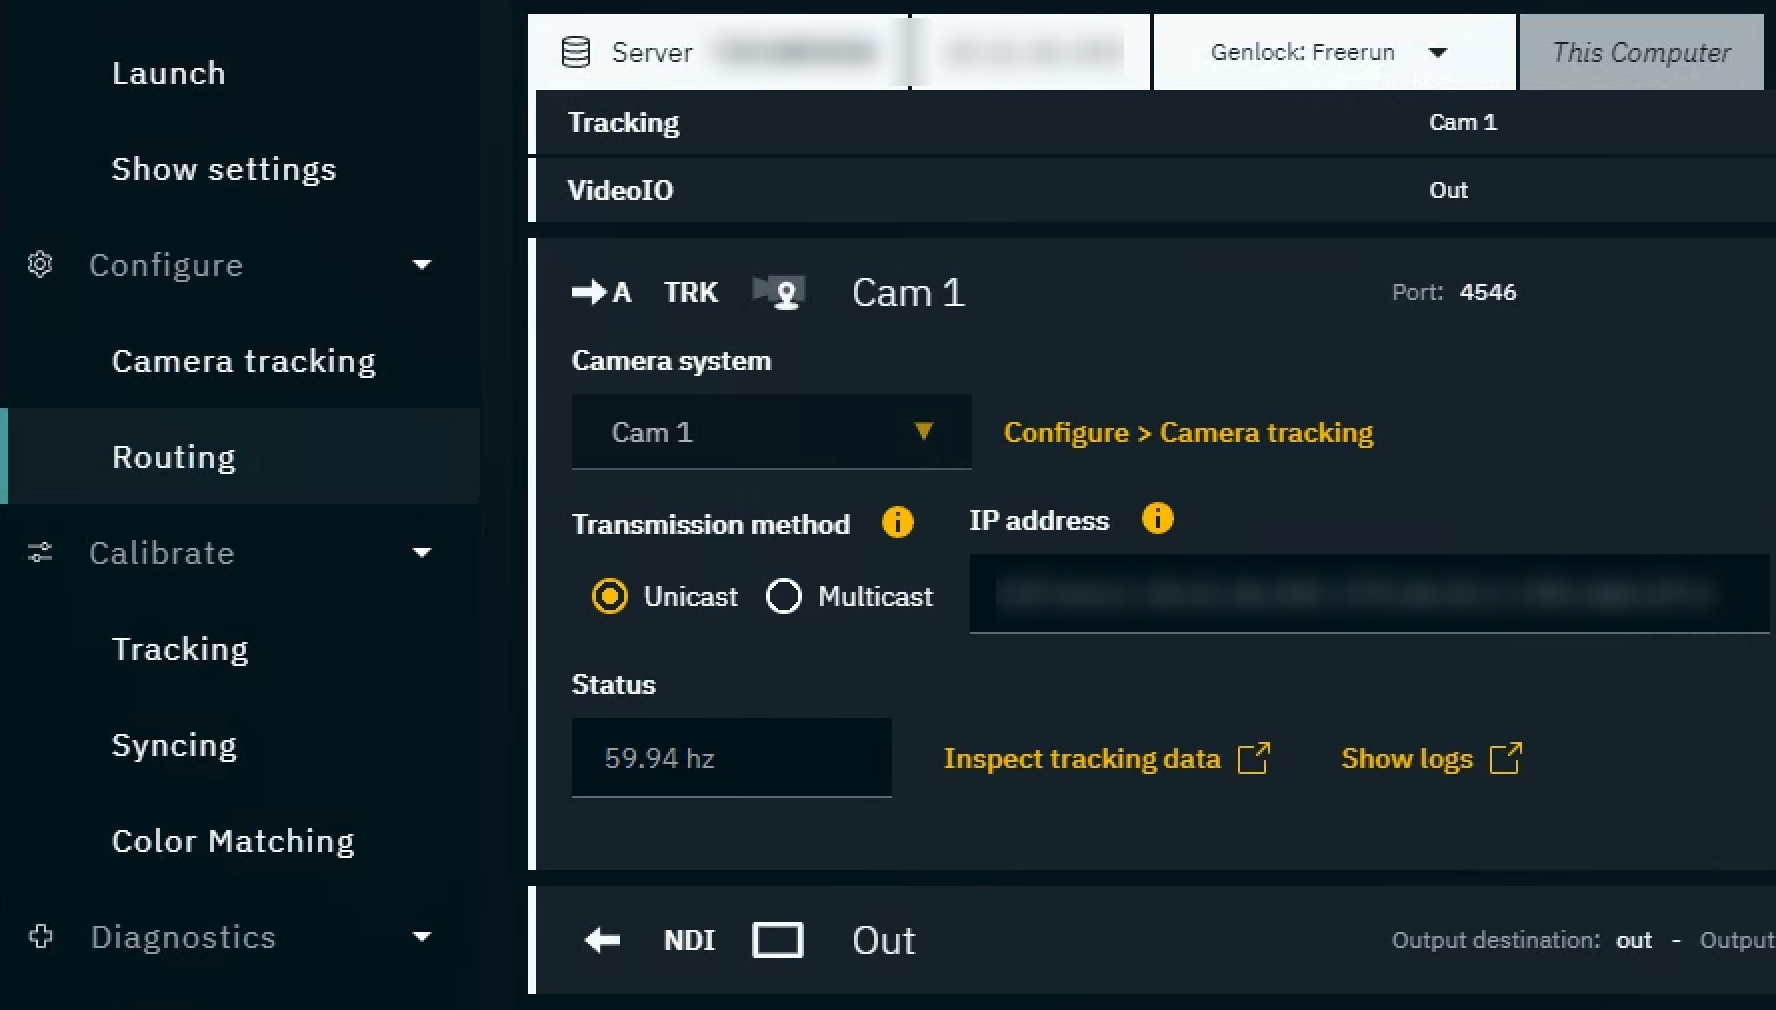
Open the plotter
-
Click on "Inspect tracking data" in Configure > Routing
-
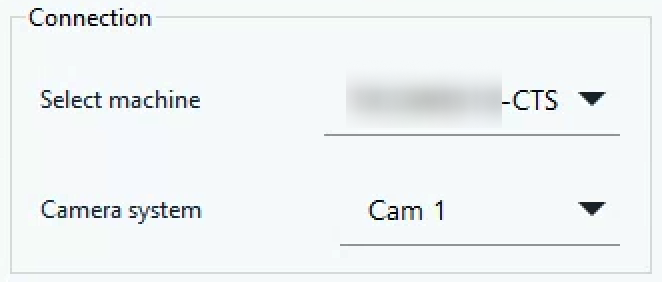
Pixotope Plotter is opened and the machine and camera system are selected
Alternatively you can also launch the executable directly by double clicking
Run-PX_LiveTrackingPlot.exe in [Installation folder]\Services\Tracking
Select data source
-
Choose the data source
|
Source |
Properties |
|---|---|
|
Tracking |
All properties available through the chosen camera. 
|
|
API |
Properties within messages broadcasted via the API
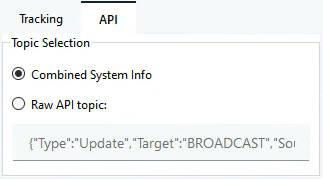
Learn more about the Pixotope API - Message Schema |
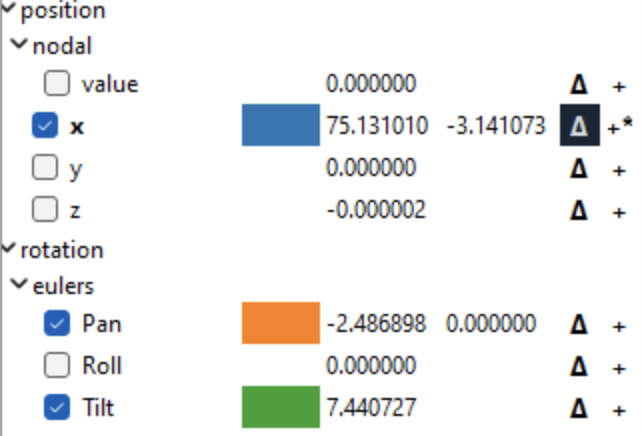
Select properties
-
Select the properties you want to display
-
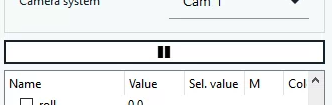
Use the Pause button to pause or restart updating data
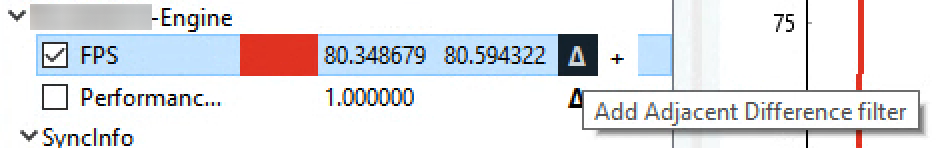
Show difference data
-
Click the Delta icon next to the parameter which you want to add the Adjacent Difference filter to
Add more filters
-
Click the + icon next to the parameter which you want to add more filters to
-
Select a filter and click “Add filter”
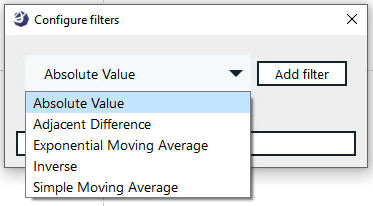
-
Click “Apply changes"
-
A parameter which has filters applied is indicated by a small *
-
Filters can be combined. For example is the Adjacent difference filter sometimes combined with the Simple Moving Average filter.
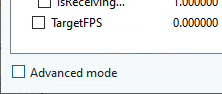
Advanced mode
The advanced mode
-
shows all parameters, also the previously hidden ones
-
allows for saving settings to be used on next startup
-
allows for viewport manipulation
-
allows for exporting data
-
Click "Advanced mode" in the bottom left corner
Export plotted data for debugging
-
Enable Advanced mode
-
Right click in the viewport and click “Export…”
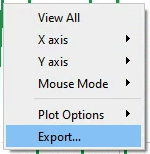
-
Choose the data and format you like and click “Export”