DebugUI was built as an internal tool for the VideoIO service, primarily for diagnosis and validation during development. However, it can also be useful for advanced users looking to gain deeper insight into VideoIO behaviour.
Be aware that DebugUI was not designed with a polished user experience in mind. Use it with care, and refer to this guide to understand what you're looking at.
Open/Close Debug UI
-
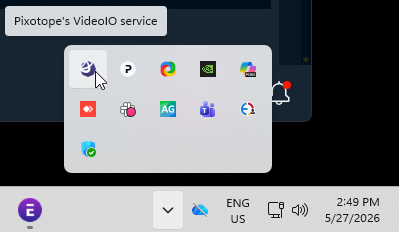
Click the VideoIO service icon in the Windows tray
-
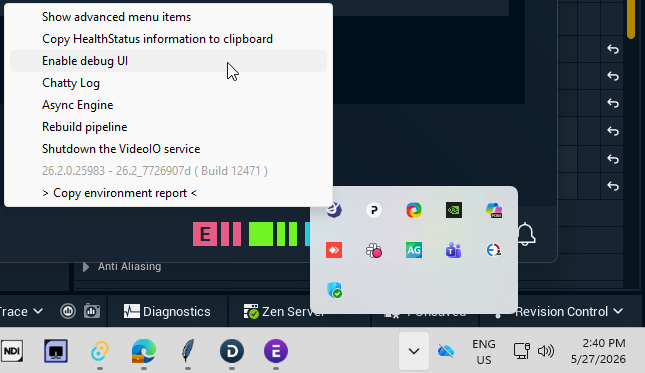
Select "Enable debug UI" from the menu
-
The Debug UI window is opened
To close the Debug UI
-
Open the videoIO service menu again
-
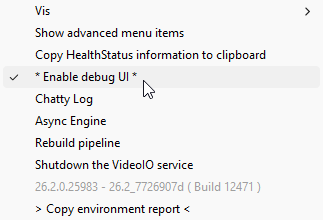
Unselect "Enable debug UI”
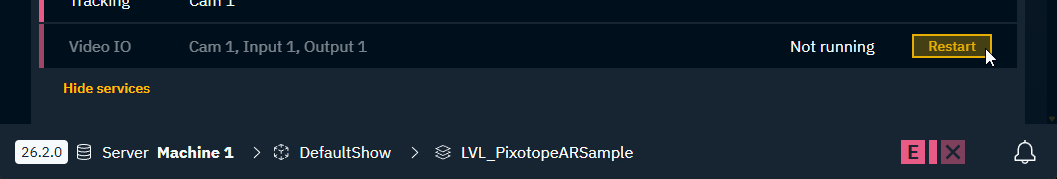
Do NOT click the x (close) icon of the Debug UI window as it stops the whole videoIO service, which then needs to be manually restarted again via the status panel.
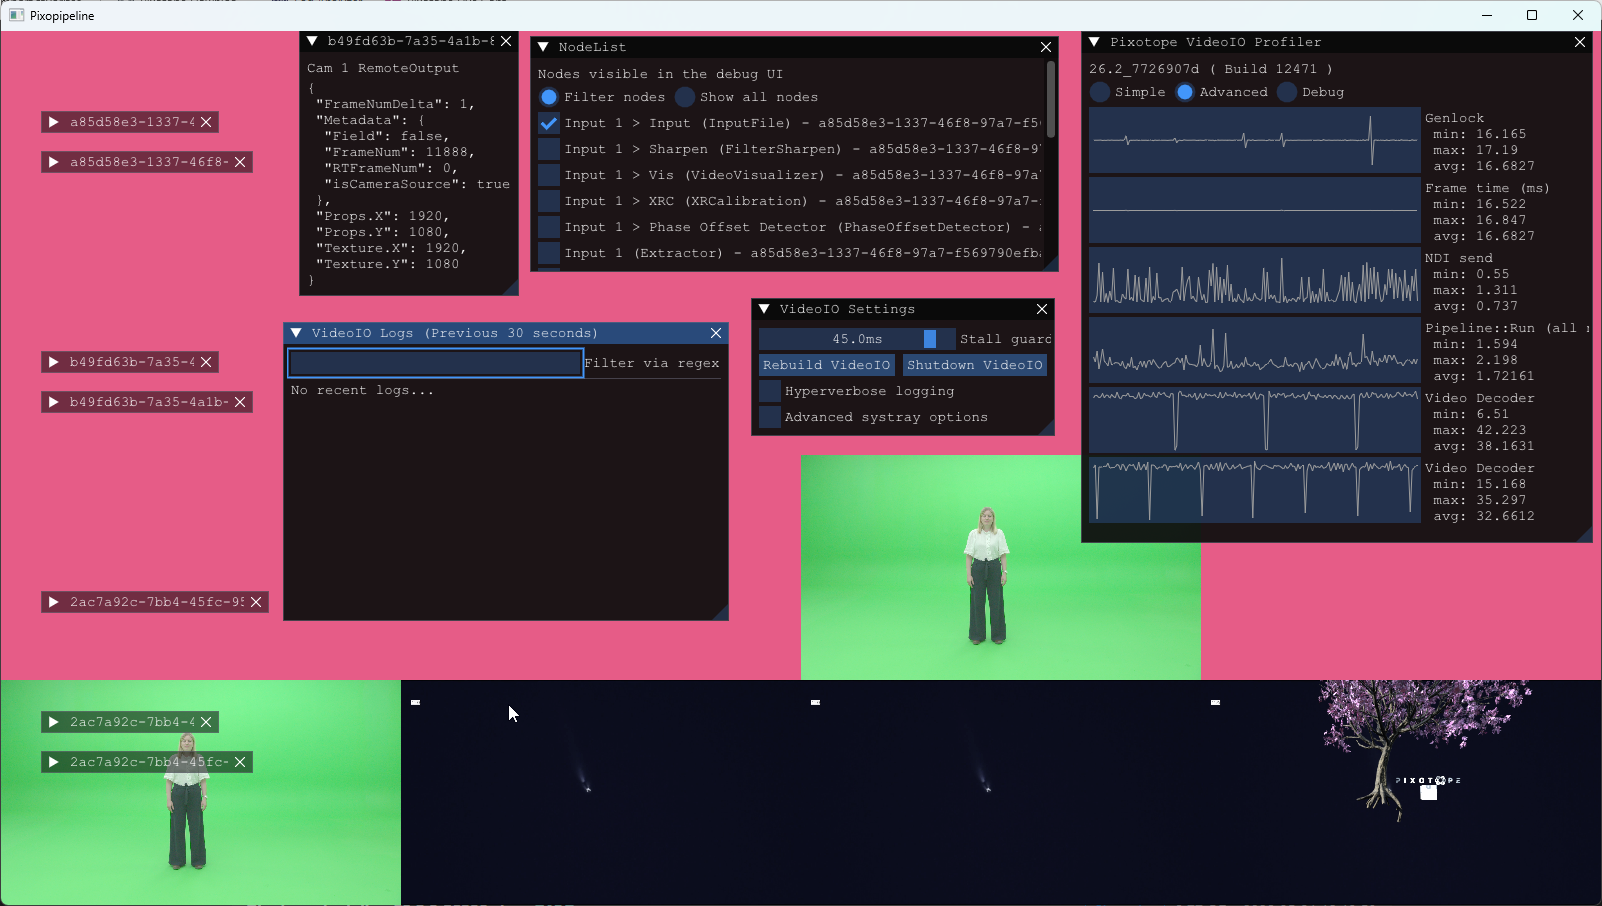
Overview
The DebugUI consists of
-
floating UI windows which are collapsible
-
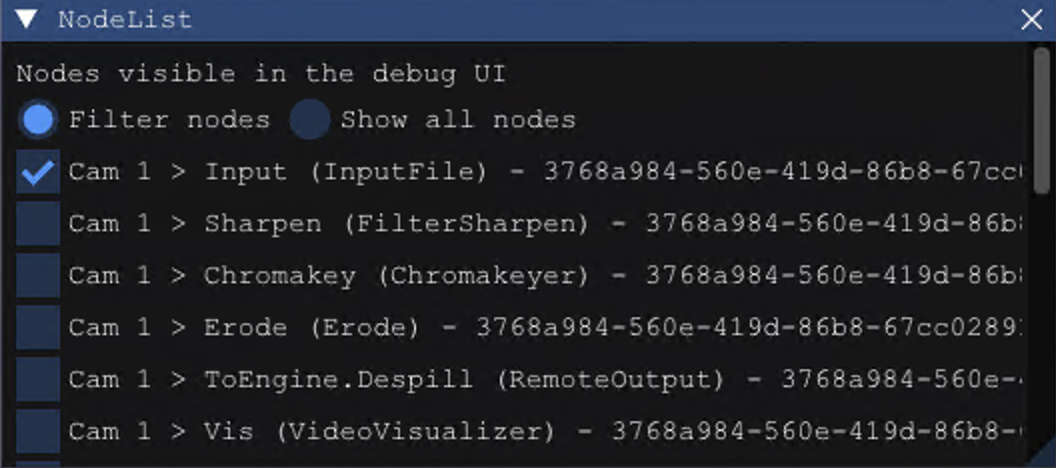
NodeList
-
VideoIO Profiler
-
VideoIO Settings
-
VideoIO Logs
-
Separate info and settings windows for all inputs and outputs
-
-
a background showing all internal nodes selected in the floating NodeList
Genlock graph
The Genlock graph (in the VideoIO Profiler) shows how much time in milliseconds has passed since the previous internal VideoIO "tick". It is an indicator of how well VideoIO is aligned with an incoming genlock signal (if any).
The graph does NOT indicate
-
the quality of the incoming genlock signal
-
whether VideoIO has sufficient resources for all computation
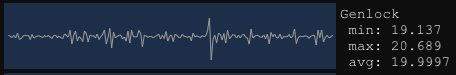
The target average is 1000 / FPS — for example, 16.66 ms at 60 fps. The graph should appear smooth and flat around this value.
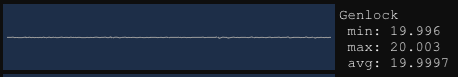
Minor spikes or dips of up to 1/10th of a tick are expected — for example, a 15.0–18.2 ms range at 60 fps. A dip following a spike (or vice versa) is normal, as VideoIO re-aligns itself automatically.
The following is also acceptable, as the min/max values remain close to the average:
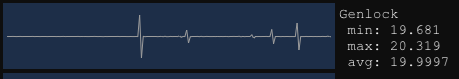
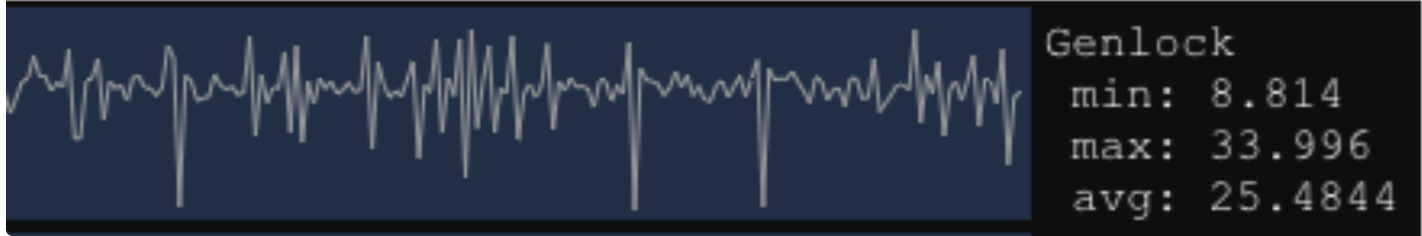
A repeated series of spikes or dips indicates that genlock is not configured correctly. The following is an example of one possible bad genlock situation:
Buffer age
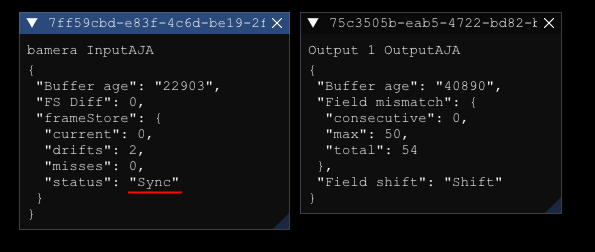
AJA Input and Output nodes each expose a Buffer age property (in microseconds) that indicates how well the input or output is performing. With correct genlock, the buffer age value should be close to a multiple of the frame time.
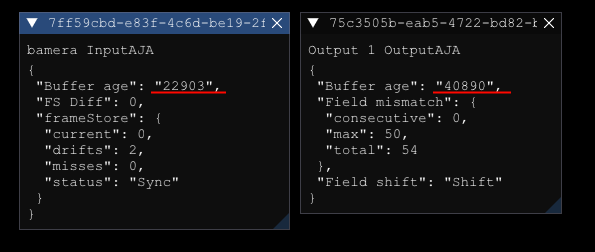
In the example above (1080i50 - 20 ms per frame), each buffer age is approximately divisible by 20,000.
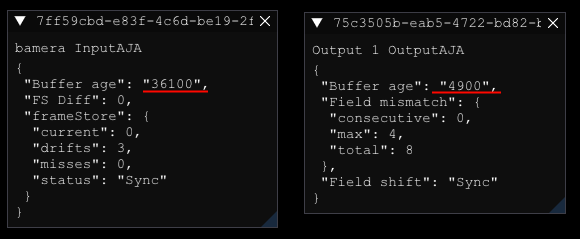
Example of bad buffer age values:
AJA input also exposes a frameStore > status field with three possible values:
|
Status |
Meaning |
|---|---|
|
Sync |
Input is stable and running smoothly. |
|
Shift |
VideoIO detected a shift but recovered. Occasional occurrences are fine. Constant alternation between Sync and Shift indicates that genlock is not configured correctly. |
|
Missed |
There is a problem with the input signal or system performance. |
Interlaced
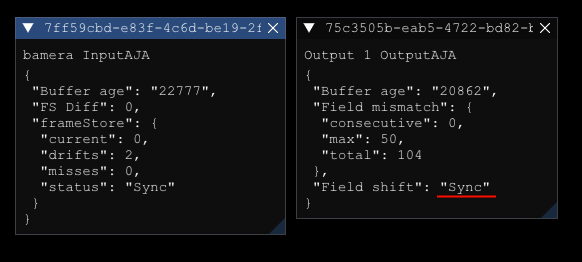
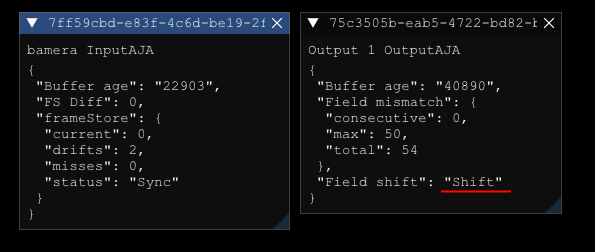
AJA Output nodes include a Field shift debug field to help diagnose how the interlaced signal is being processed. It can show either Sync or Shift.
|
State |
Meaning |
|---|---|
|
Permanently Sync or Shift |
The interlaced signal is being processed correctly. The steady state depends on the Engine Transfer Delay setting. |
|
Flashing between Sync and Shift |
The interlaced input or output is not locked correctly, or the system is experiencing a performance issue. |
|
Sync drifting to Shift over time |
The input signal has drifted relative to the generated output due to poor, incorrect, or missing genlock. In tests with 1080i50, this drift typically takes around 20–30 minutes to manifest. |
Timings
When investigating performance issues or stutters, review all performance graphs together.
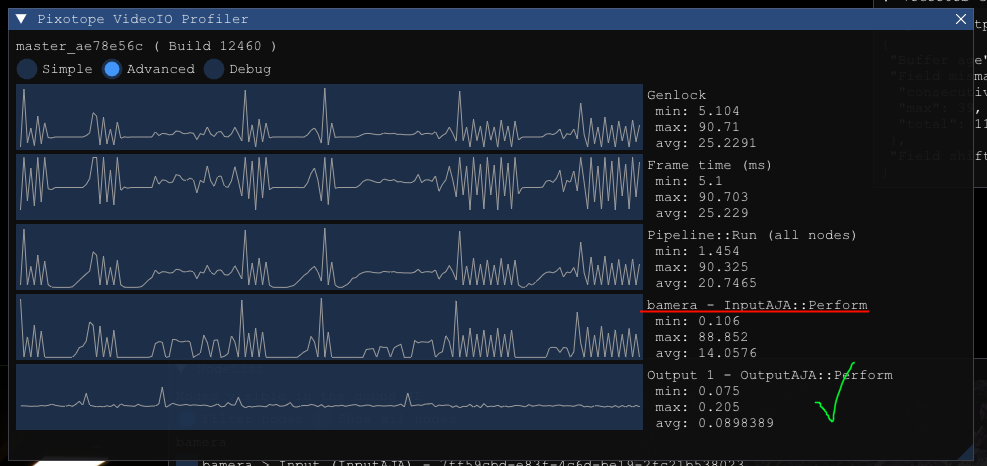
Genlock, Frame time, and Pipeline::Run are interdependent and will typically show similar patterns.
In the example above, AjaOutput appears healthy while AjaInput shows irregular patterns - indicating that a feature or option configured on that AJA Input routing may be the source of the performance impact, and investigation should focus there rather than on the output.