Learn more about Creating a control panel - PRODUCTION
Learn more about Control panel - Keyboard shortcuts
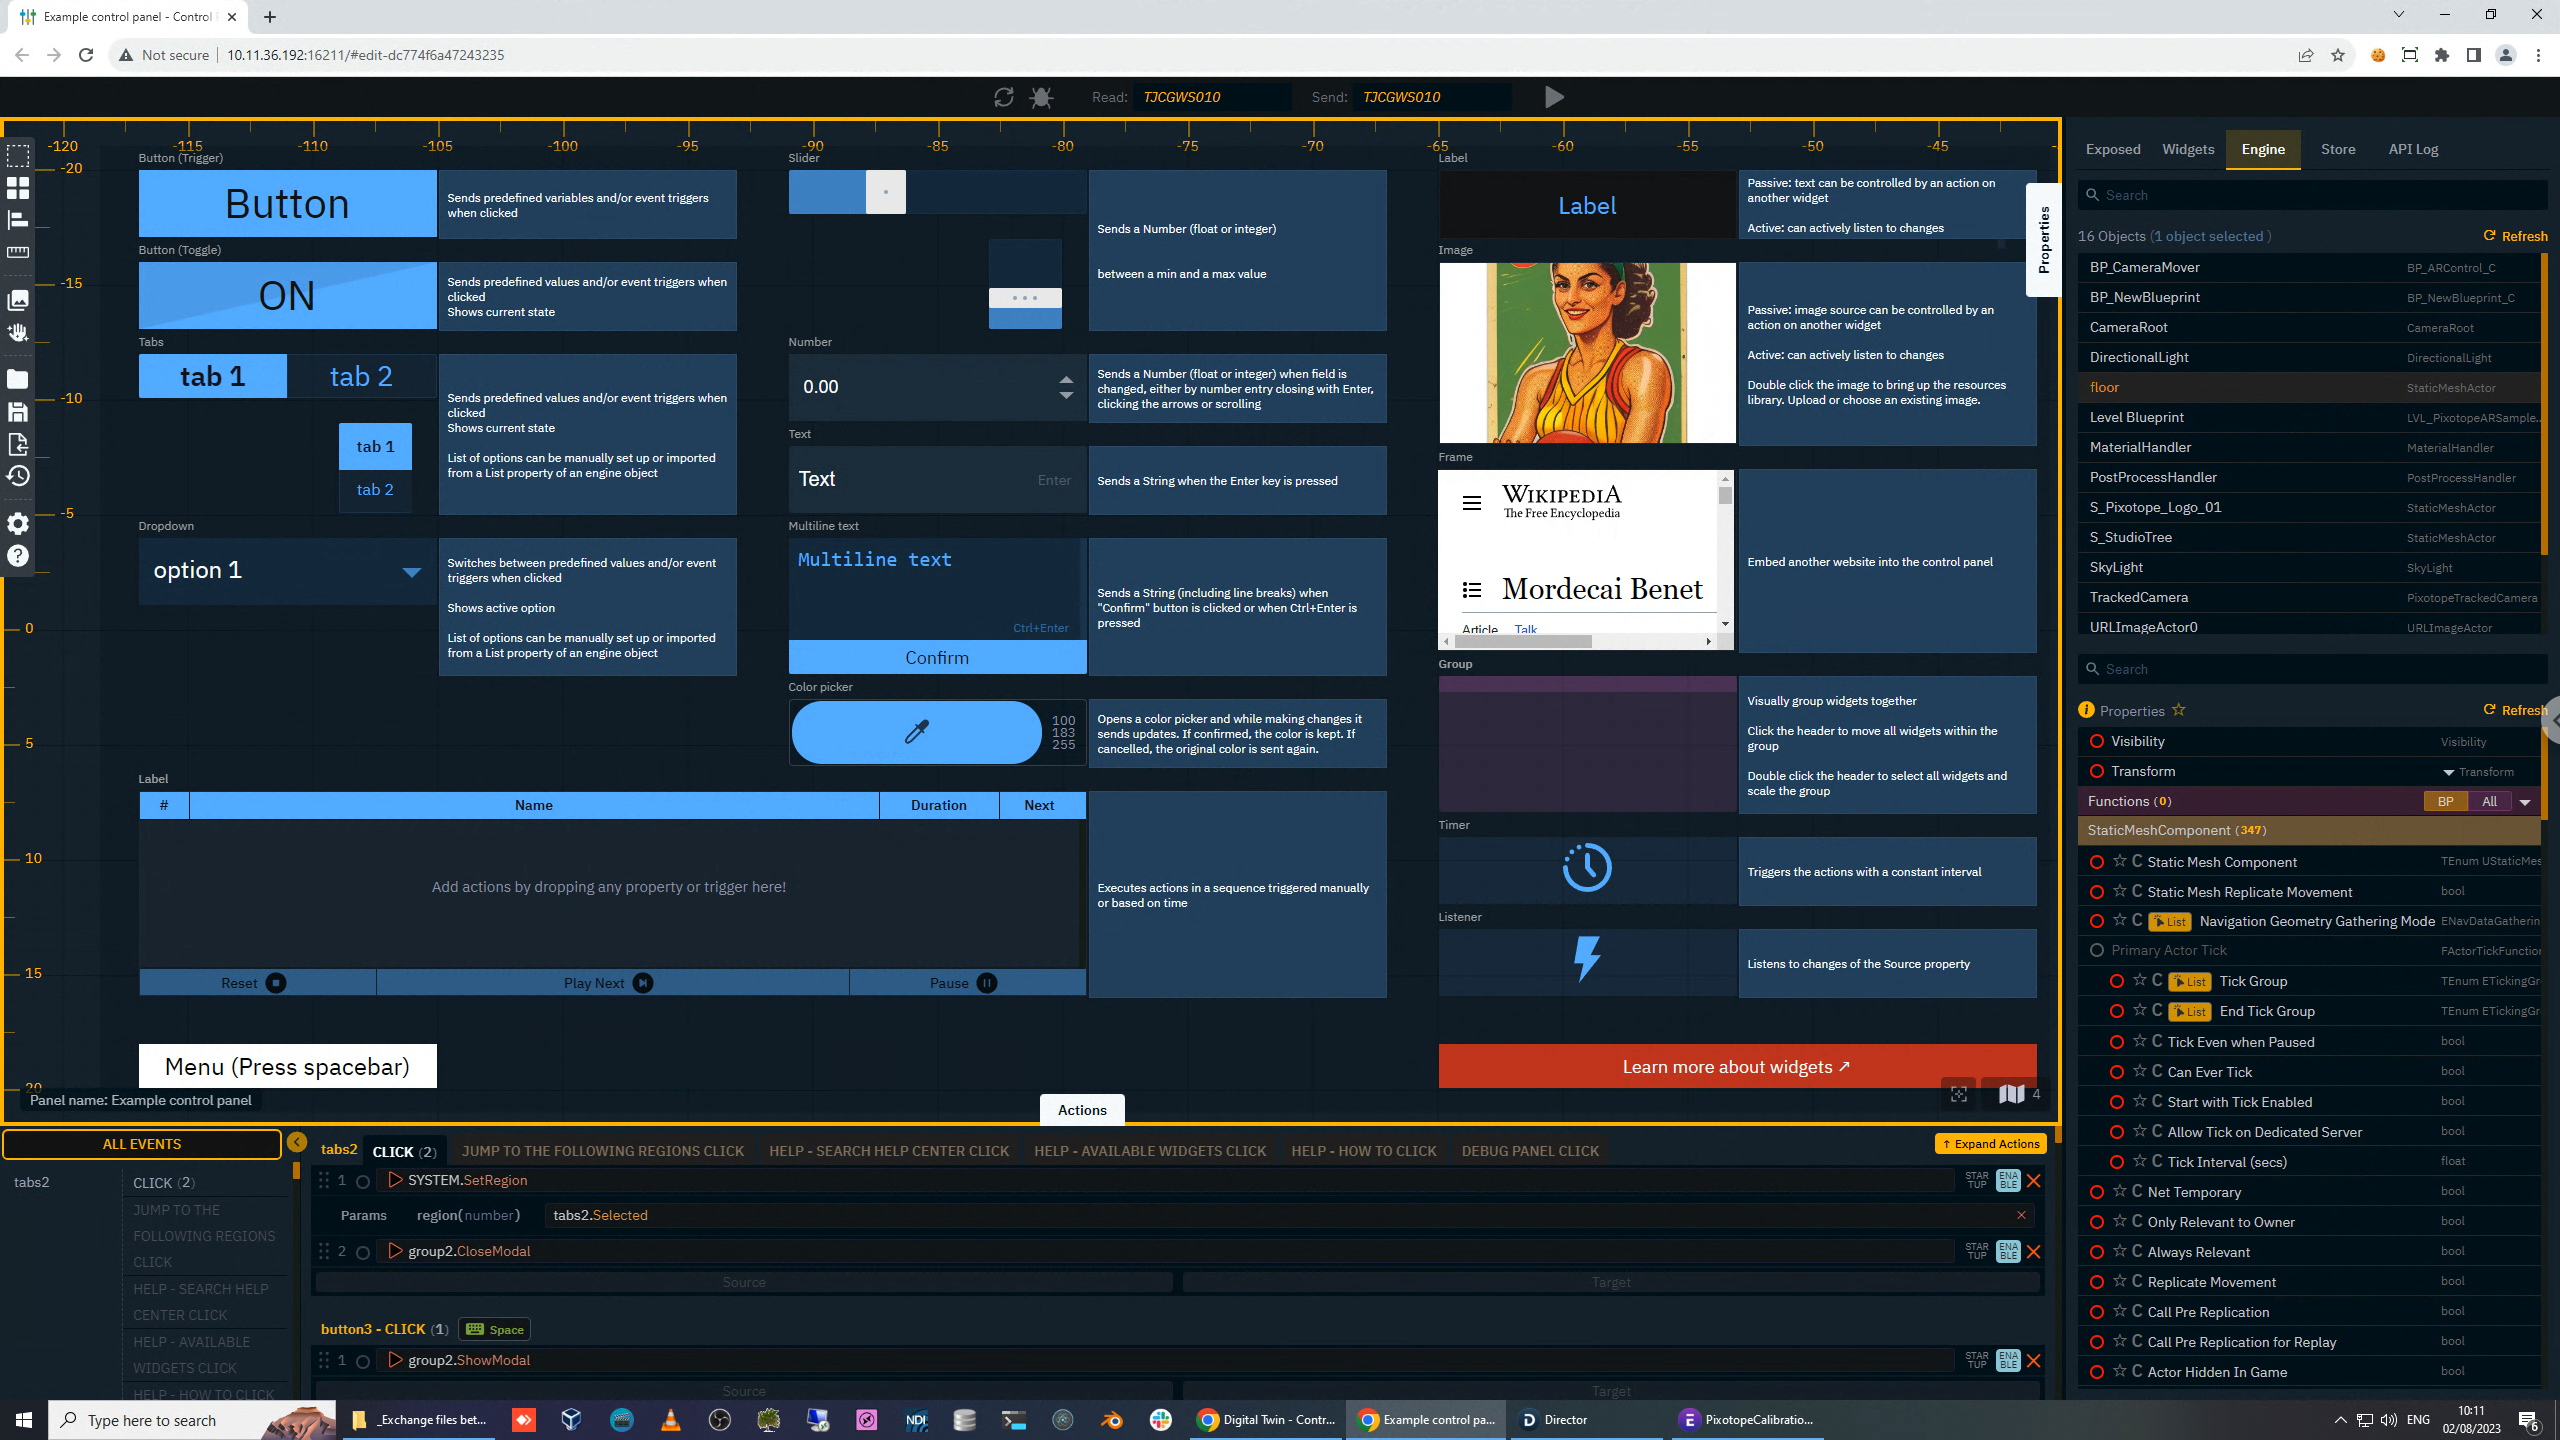
General
The Control Panel runs in a browser. It has been developed for Google Chrome. Other browsers have not been tested, but should also work.
The Control Panel page is served by the Pixotope Director which has launched/created it. In case this Pixotope Director is shut down, the control panel will loose connection and wait for Pixotope to be started up again.
Header (top)
Reset sync data
Resets sync data which is used to keep state data, like pressed toggle states, in sync between the same control panel open on different machines/in different browsers.
Debug actions
Helps to debug API log actions.
Learn more about how to Debug actions
Read from send to header
Select which engine to read from, and which to send to
Make sure a level is running to gather its engine content and properties
-
Select one machine to read from using the machine dropdown on the left
-
Only machines which have a level launched (running engine) are listed
-
-
Select one or more machines to send to by toggling them on
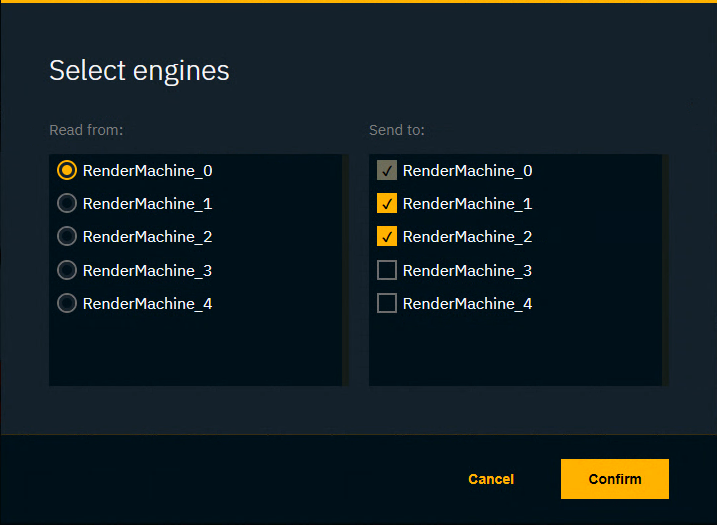
The Read from Send to header is similar to the one in the adjustment panels. Learn more about Adjusting levels - where it reads from and sends to
Play/Stop
Toggle between Edit and Preview Live mode
Shortcuts bar (left)
|
|
|
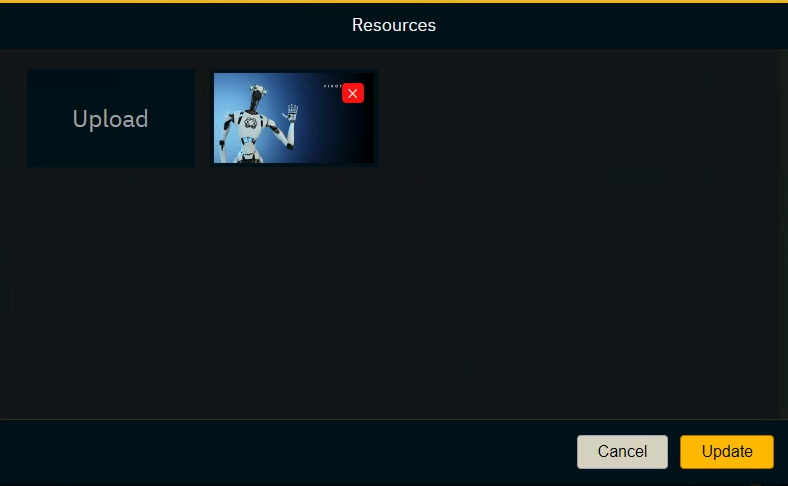
Resources library
Add/Remove image resources
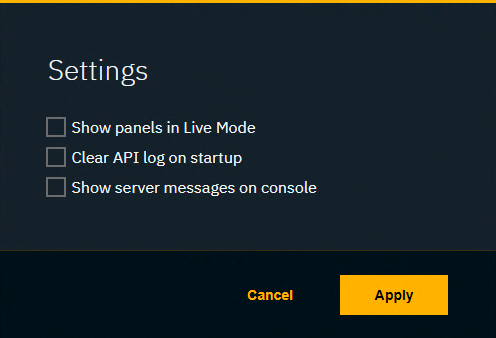
Settings
Make changes to the behaviour and look of the Control Panel Editor
-
Show panels in Live Mode - keep the drawers open to allow editing even when in Live mode
-
Clear API log on startup
-
Show server messages on console
Properties (right)
Exposed tab
Shows all properties (widgets/objects) which had been exposed either from the Editor or in one of the other tabs.
Widgets tab
-
Shows all widgets placed on your canvas
-
Allows to edit all the properties
Engine tab
-
Shows all objects/actors in a level
-
Allows to expose properties
Store tab (for advanced users)
-
Shows all properties of the current show file
API Log tab (for advanced users)
-
Shows all Pixotope API messages
Action List (bottom)
-
Left side: Shows all possible actions for all widgets on the canvas
-
Selecting one from here (or double clicking the widget on the canvas) will filter the widgets action on the right side
-
-
Right side: Allows you to drag & drop a source and target from the Properties drawer
OR double click the source field to edit the value directly
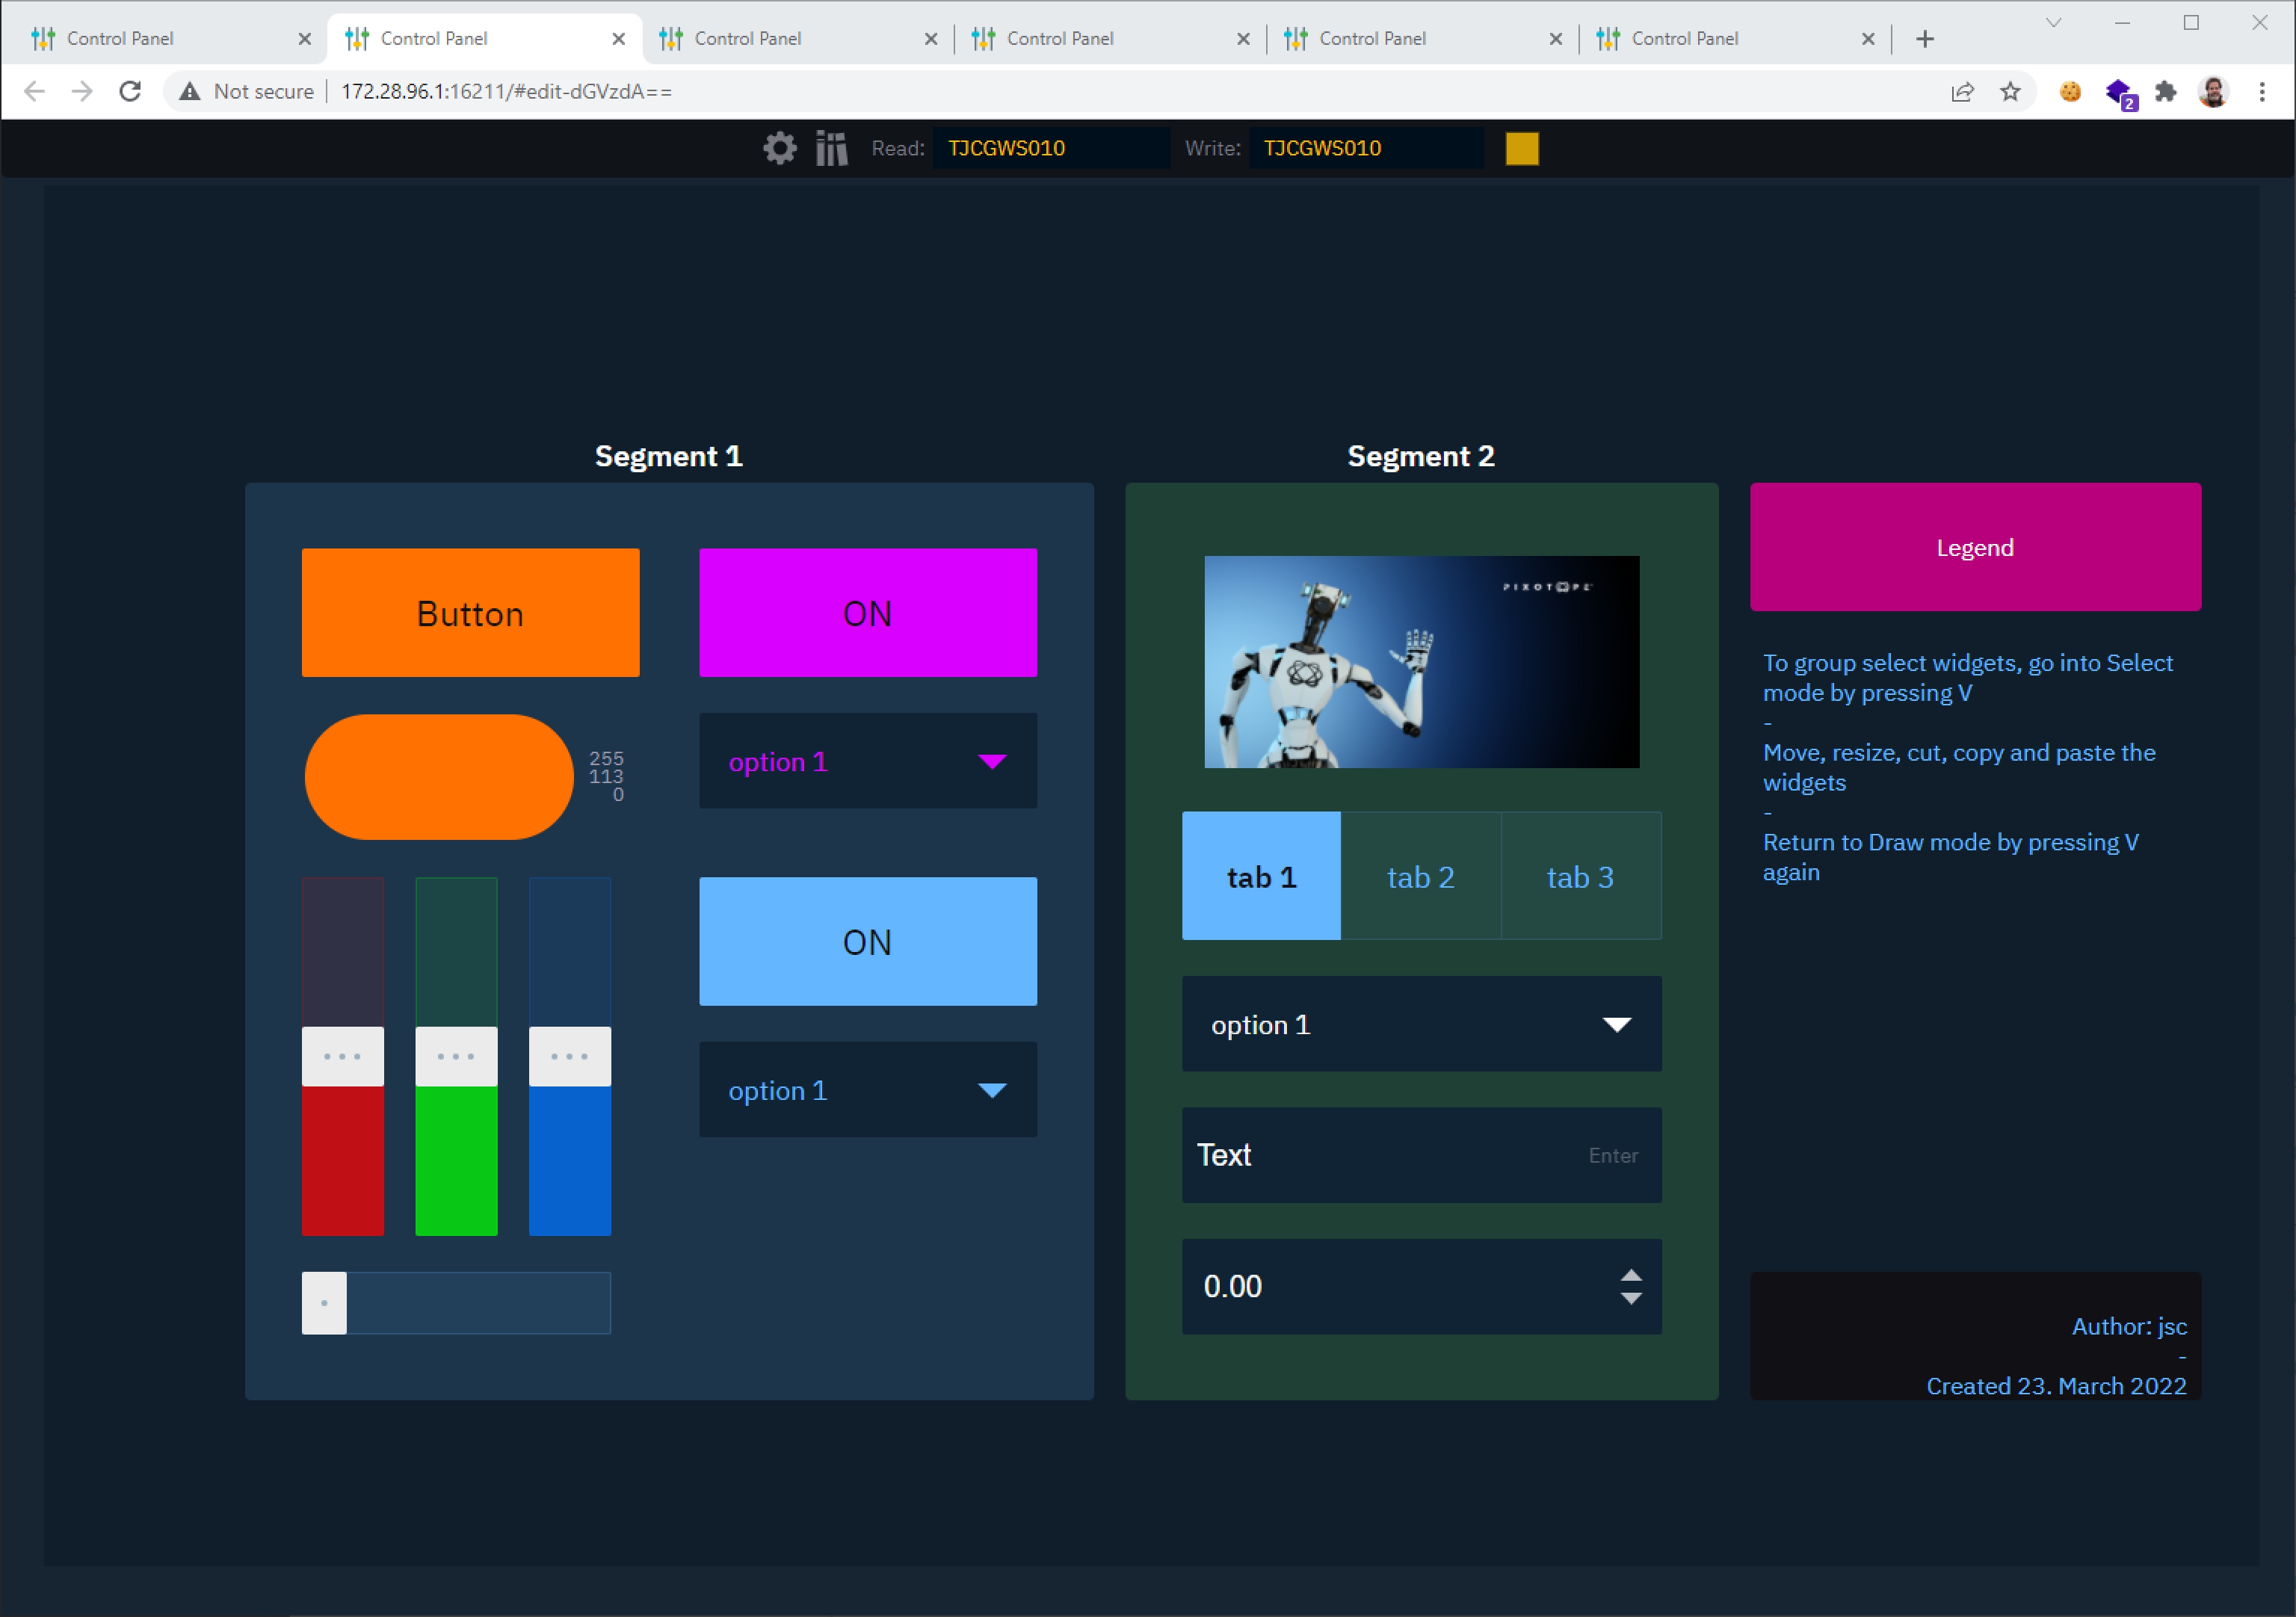
Canvas
-
The working area where widgets are drawn. The entire canvas is usable in Edit mode; in Preview Live mode, the canvas will be fixed on the main viewport (the darker portion of the canvas)
Learn more about available widget types
Hold spacebar while dragging to move around the different regions of the canvas, or press the numbers 1-9 on your keyboard.
The Map icon on the bottom right of the canvas shows an interactive mini-map of the canvas.
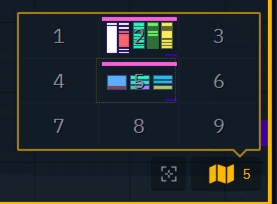
Lastly, the centre square icon (or C on a keypad) will centre your canvas to the middle, or region number 5.